
Concept explainers
Videos
Lung cancer and Smoking The following table gives the crude male death rate for lung cancer in 1950 and the per capita consumption of cigarettes in 1930 in various countries. Figure 13 shows the least-squares line for the data. (Source: U.S. Dept. of Health, Education, and Welfare)
Country |
Cigarette Consumption (Per-Capita) |
Lung Cancer Deaths (Per Million Males) |
Norway |
250 |
95 |
Sweden |
300 |
120 |
Denmark |
350 |
165 |
Australia |
470 |
170 |
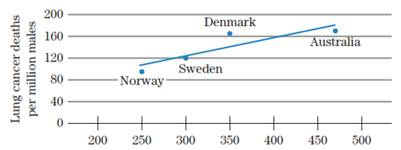
Per capita cigarette consumption
Figure 13
(a) Obtain the equation of the line in Fig. 13.
(b) In 1930, the per capita cigarette consumption in Finland was 1100. Use the equation found in part (a) to estimate the male lung cancer death rate in Finland in 1950.
Want to see the full answer?
Check out a sample textbook solution
Chapter 1 Solutions
MyLab Math plus Pearson eText -- Standalone Access Card -- for Finite Mathematics & Its Applications (12th Edition)


 Elementary Linear Algebra (MindTap Course List)AlgebraISBN:9781305658004Author:Ron LarsonPublisher:Cengage Learning
 Linear Algebra: A Modern IntroductionAlgebraISBN:9781285463247Author:David PoolePublisher:Cengage Learning
 Functions and Change: A Modeling Approach to Coll...AlgebraISBN:9781337111348Author:Bruce Crauder, Benny Evans, Alan NoellPublisher:Cengage Learning