To explain:
The difference between short-run and long-run
Explanation of Solution
At natural rate of
The difference between the short-run Philips curve and long-run Philips curve is shown in the diagram below:
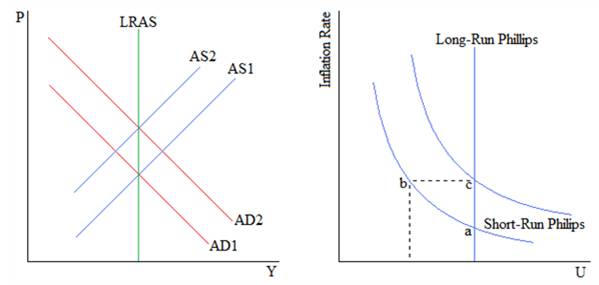
On the left, the Aggregate Demand (AD) increases from AD1 to AD2, as the result of an increase in government spending. This increases aggregate income (Y) in the short run and the price level (P) rises. However, in the long run, Aggregate Supply (AS) decreases from AS1 to AS2 because of higher input costs due to inflation and the price level rises again.As a result, Long Run Aggregate Supply (LRAS) is fixed.
On the right, the increases in the price level translate to higher inflation. This leads to lower rates of unemployment (U) in the short run. Starting at a point a, the curve moves to point b. However, as Aggregate Supply decreases, the Short-Run Philips curve shifts up. Moving from point b to point c, the inflation stays high and the unemployment increases. In the long run, the unemployment is fixed with respect to the inflation rate.
Philips Curve:
Phillips curve is a graphical representation of the relationship between inflation rate and unemployment. This curve states that there is an inverse relationship between inflation and unemployment.
Aggregate demand:
Aggregate demand is the total demand for final goods and services at a given time.
Aggregate supply:
Aggregate supply is the total supply of goods and services available in a market place.
Want to see more full solutions like this?
Chapter 14 Solutions
Macroeconomics (MindTap Course List)

- Draw a short run Phillips curve and show the slope of the curve and thenexplain what it implies for the policy makers?arrow_forwardThe slope of the Phillips curve: Draw a graph with a steep Phillips curve anda graph with a gently sloped Phillips curve.arrow_forwardDuring an election term, the government increases its spending temporarily. Show the effect of this shock on the economy using the IS-MP-PC model. Explain how and why you would change the interest rate in response to this shock. Make sure to draw the IS-MP diagram and Phillips curve.arrow_forward
 Brief Principles of Macroeconomics (MindTap Cours...EconomicsISBN:9781337091985Author:N. Gregory MankiwPublisher:Cengage Learning
 Exploring EconomicsEconomicsISBN:9781544336329Author:Robert L. SextonPublisher:SAGE Publications, Inc


 Economics (MindTap Course List)EconomicsISBN:9781337617383Author:Roger A. ArnoldPublisher:Cengage Learning