
Statistical Techniques in Business and Economics
18th Edition
ISBN: 9781260579611
Author: Douglas Lind; William Marchal; Samuel Wathen
Publisher: MCGRAW-HILL HIGHER EDUCATION
expand_more
expand_more
format_list_bulleted
Concept explainers
Videos
Textbook Question
Chapter 14, Problem 22CE
A regional planner is studying the demographics of nine counties in the eastern region of an Atlantic seaboard state. She has gathered the following data:
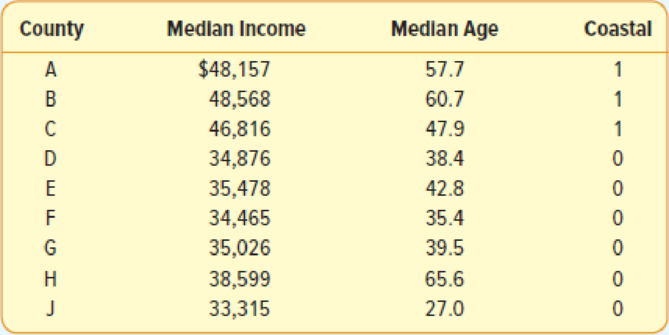
- a. Is there a linear relationship between the
median income and median age? - b. Which variable is the “dependent” variable?
- c. Use statistical software to determine the regression equation. Interpret the value of the slope in a simple regression equation.
- d. Include the aspect that the county is “coastal” or not in a multiple linear
regression analysis using a “dummy” variable. Does it appear to be a significant influence on incomes? - e. Test each of the individual coefficients to see if they are significant.
- f. Make a plot of the residuals and comment on whether they appear to follow a
normal distribution . - g. Plot the residuals versus the fitted values. Do they seem to have the same amount of variation?
Expert Solution & Answer
Want to see the full answer?
Check out a sample textbook solution
Students have asked these similar questions
One of the biggest changes in higher education in recent years has been the growth of online universities. The Online Education Database is an independent organization whose mission is to build a comprehensive list of the top accredited online colleges. The following table shows the retention rate (%) and the graduation rate (%) for 29 online colleges.a). Use Excel Data Analysis Tool – Regression to get the relationship between the two variables;b). Create a scatter diagram for the two variables and display regression equation and R square on chart, then explain the relationship between the variables;c). Did the estimated regression equation provide a good fit?d). Suppose you were the president of South University. After reviewing the results, would you be able to use the regression result for forecasting.
College
RR(%)
GR(%)
Western International University
7
25
South University
51
25
University of Phoenix
4
28
American InterContinental University
29
32
Franklin…
A. Write the equation of the regression line.
B. Interpret the slope in this context, and calculate the predicted birth weight of first borns and others
C. Is there a statistically significant relationship between the average birth weight and parity? Provide an explanation with numeric support.
For a data set consisting of two data points:
a. Identify the regression line.
b. What is the sum of squared errors for the regression line? Explain your answer.
Chapter 14 Solutions
Statistical Techniques in Business and Economics
Ch. 14 - There are many restaurants in northeastern South...Ch. 14 - Prob. 1ECh. 14 - Thompson Photo Works purchased several new, highly...Ch. 14 - A consulting group was hired by the Human...Ch. 14 - Cellulon, a manufacturer of home insulation, wants...Ch. 14 - Refer to Self-Review 141 on the subject of...Ch. 14 - Prob. 5ECh. 14 - Prob. 6ECh. 14 - Prob. 3SRCh. 14 - Given the following regression output, answer the...
Ch. 14 - The following regression output was obtained from...Ch. 14 - A study by the American Realtors Association...Ch. 14 - The manager of High Point Sofa and Chair, a large...Ch. 14 - Prob. 10ECh. 14 - Prob. 11ECh. 14 - A real estate developer wishes to study the...Ch. 14 - Prob. 13CECh. 14 - Prob. 14CECh. 14 - Prob. 15CECh. 14 - Prob. 16CECh. 14 - The district manager of Jasons, a large discount...Ch. 14 - Suppose that the sales manager of a large...Ch. 14 - The administrator of a new paralegal program at...Ch. 14 - Prob. 20CECh. 14 - Prob. 21CECh. 14 - A regional planner is studying the demographics of...Ch. 14 - Great Plains Distributors, Inc. sells roofing and...Ch. 14 - Prob. 24CECh. 14 - Prob. 25CECh. 14 - Prob. 26CECh. 14 - Prob. 28CECh. 14 - Prob. 29CECh. 14 - The director of special events for Sun City...Ch. 14 - Prob. 31CECh. 14 - Prob. 32CECh. 14 - Prob. 33DACh. 14 - Prob. 34DACh. 14 - Prob. 35DACh. 14 - Prob. 1PCh. 14 - Quick-print firms in a large downtown business...Ch. 14 - The following ANOVA output is given. a. Compute...Ch. 14 - Prob. 1CCh. 14 - Prob. 2CCh. 14 - Prob. 3CCh. 14 - In a scatter diagram, the dependent variable is...Ch. 14 - What level of measurement is required to compute...Ch. 14 - If there is no correlation between two variables,...Ch. 14 - Which of the following values indicates the...Ch. 14 - Under what conditions will the coefficient of...Ch. 14 - Given the following regression equation, = 7 ...Ch. 14 - Given the following regression equation, = 7 ...Ch. 14 - Given the following regression equation, = 7 ...Ch. 14 - Prob. 1.9PTCh. 14 - In a multiple regression equation, what is the...Ch. 14 - Prob. 1.11PTCh. 14 - Prob. 1.12PTCh. 14 - For a dummy variable, such as gender, how many...Ch. 14 - What is the term given to a table that shows all...Ch. 14 - If there is a linear relationship between the...Ch. 14 - Given the following regression analysis output: a....Ch. 14 - Given the following regression analysis output. a....
Knowledge Booster


Learn more about
Need a deep-dive on the concept behind this application? Look no further. Learn more about this topic, statistics and related others by exploring similar questions and additional content below.Similar questions
- Find the equation of the regression line for the following data set. x 1 2 3 y 0 3 4arrow_forwardBowling Corporation wants to know how closely its current cost driver is correlated with its monthly operating costs. The managerial accountant runs a regression analysis using a statistical software program and produces the following data: Intercept Coefficient = 12,200,567 X Variable 1 Coefficient = 95.65 R-square= 0.8574 What is the Bowling Corporation's monthly cost equation? OA. y $95.65x + $12,200,567 OB. y $95.65x + $8.574 O c. y = $0.8574x + $12,200,567 O D. y = $12,200,567x + $8,574 ---arrow_forwardState the regression equation and use it to predict taxes for a house with lot size 10K.arrow_forward
- a. Using any statistical software, produce a scatter plot for these data with stress test score as the independent variable and the blood pressure as the dependent variable.b. Describe the form, trend, and strength of of the association between stress test scores and blood pressure.c. Produce the line of best fit and the estimate linear regression.d. Estimate the blood pressure of the student if his stress test score is 80, 60, and 85.arrow_forwardThe St. Lucian Government is interested in predicting the number of weekly riders on the public buses using the following variables: • • • • Price of bus trips per weekThe population in the cityThe monthly income of ridersAverage rate to park your personal vehicle Determine the multiple regression equation for the data. What is the predicted value of the number of weekly riders if: price of bus trips per week = $24; population = $2,000,000; the monthly income of riders = $13,500; and average rate to park your personal vehicle = $150. Interpret the coefficient of determination.arrow_forwarda. Draw a scatter diagram for the data. b. Draw a regression line of y on x. c. Determine the equation of the line of best fit.arrow_forward
- The regional transit authority for a major metropolitan area wants to determine whetherthere is a relationship between the age of a bus and the annual maintenance cost. A sampleof ten buses resulted in the following data: a. Develop a scatter chart for these data. What does the scatter chart indicate about therelationship between age of a bus and the annual maintenance cost?b. Use the data to develop an estimated regression equation that could be used to predictthe annual maintenance cost given the age of the bus. What is the estimated regressionmodel?c. Test whether each of the regression parameters b0 and b1 is equal to zero at a 0.05level of significance. What are the correct interpretations of the estimated regressionparameters? Are these interpretations reasonable?d. How much of the variation in the sample values of annual maintenance cost does themodel you estimated in part b explain?e. What do you predict the annual maintenance cost to be for a 3.5-year-old bus?arrow_forwardThe datasetBody.xlsgives the percent of weight made up of body fat for 100 men as well as other variables such as Age, Weight (lb), Height (in), and circumference (cm) measurements for the Neck, Chest, Abdomen, Ankle, Biceps, and Wrist. We are interested in predicting body fat based on abdomen circumference. Find the equation of the regression line relating to body fat and abdomen circumference. Make a scatter-plot with a regression line. What body fat percent does the line predict for a person with an abdomen circumference of 110 cm? One of the men in the study had an abdomen circumference of 92.4 cm and a body fat of 22.5 percent. Find the residual that corresponds to this observation. Bodyfat Abdomen 32.3 115.6 22.5 92.4 22 86 12.3 85.2 20.5 95.6 22.6 100 28.7 103.1 21.3 89.6 29.9 110.3 21.3 100.5 29.9 100.5 20.4 98.9 16.9 90.3 14.7 83.3 10.8 73.7 26.7 94.9 11.3 86.7 18.1 87.5 8.8 82.8 11.8 83.3 11 83.6 14.9 87 31.9 108.5 17.3…arrow_forwardBody Fat. Where we considered the regression of percentage of body fat on nine body measurements: height, weight, hip, forearm, neck, wrist, triceps, scapula, and sup. Describe and discuss problems that could have arisen in the collection of the data for this regression analysis.arrow_forward
- a) Write out the regression equation. b) Fill in the missing values *, **, *** and ****. c) Use the p-value approach to determine if ? is significant at the 5% significance levelarrow_forwardThe sheet called HousePr contains data on prices of houses that have sold recently and two attributes of the house – the number of bedrooms and the size. Column 1 is the selling price of the house in thousands of dollars and column 2 is the size in hundreds of square feet.a. Draw a scattergram of price vs size. Discuss whether this scattergram supports an assumption of a linear relationship between price and size.b. Using Excel, obtain the equation of the linear regression line that fits this data for price vs. size.c. Using relevant Excel output, discuss whether the true slope of the regression line is different from zero.d. What is the expected price for a house with size 2000 square feet? Using relevant Excel output, discuss whether the margin of error of this expected price will be low or high.e. Using Excel, obtain the equation of the linear regression line that fits this data for price vs. number of bedrooms. Is the true slope different from zero?f. What is the expected price for…arrow_forwardIs the number of calories in a beer related to the number of carbohydrates and/or the percentage of alcohol in the beer? The accompanying table has data for 35 beers. The values for three variables are included: the number of calories per 12ounces, the alcohol percentage, and the number of carbohydrates (in grams) per 12 ounces. a. Perform a multiple linear regression analysis, using calories as the dependent variable and percentage alcohol and number of carbohydrates as the independent variables. Let X1 represent alcohol percentage and let X2 represent the number of carbohydrates. (Round to four decimal places as needed.)arrow_forward
arrow_back_ios
SEE MORE QUESTIONS
arrow_forward_ios
Recommended textbooks for you
 Glencoe Algebra 1, Student Edition, 9780079039897...AlgebraISBN:9780079039897Author:CarterPublisher:McGraw Hill
 Holt Mcdougal Larson Pre-algebra: Student Edition...AlgebraISBN:9780547587776Author:HOLT MCDOUGALPublisher:HOLT MCDOUGAL
 Functions and Change: A Modeling Approach to Coll...AlgebraISBN:9781337111348Author:Bruce Crauder, Benny Evans, Alan NoellPublisher:Cengage Learning
 Big Ideas Math A Bridge To Success Algebra 1: Stu...AlgebraISBN:9781680331141Author:HOUGHTON MIFFLIN HARCOURTPublisher:Houghton Mifflin Harcourt
Glencoe Algebra 1, Student Edition, 9780079039897...
Algebra
ISBN:9780079039897
Author:Carter
Publisher:McGraw Hill
Holt Mcdougal Larson Pre-algebra: Student Edition...
Algebra
ISBN:9780547587776
Author:HOLT MCDOUGAL
Publisher:HOLT MCDOUGAL
Functions and Change: A Modeling Approach to Coll...
Algebra
ISBN:9781337111348
Author:Bruce Crauder, Benny Evans, Alan Noell
Publisher:Cengage Learning
Big Ideas Math A Bridge To Success Algebra 1: Stu...
Algebra
ISBN:9781680331141
Author:HOUGHTON MIFFLIN HARCOURT
Publisher:Houghton Mifflin Harcourt
Correlation Vs Regression: Difference Between them with definition & Comparison Chart; Author: Key Differences;https://www.youtube.com/watch?v=Ou2QGSJVd0U;License: Standard YouTube License, CC-BY
Correlation and Regression: Concepts with Illustrative examples; Author: LEARN & APPLY : Lean and Six Sigma;https://www.youtube.com/watch?v=xTpHD5WLuoA;License: Standard YouTube License, CC-BY