
Basic Business Statistics
14th Edition
ISBN: 9780134684840
Author: BERENSON, Mark L., Levine, David M., Szabat, Kathryn A.
Publisher: Pearson,
expand_more
expand_more
format_list_bulleted
Videos
Textbook Question
Chapter 14, Problem 25PS
In Problem 14.3 on page 541, you predicted nonprofit charitable commitment, based on nonprofit (Revenue) and fundraising efficiency (Efficiency) for a sample of 98 nonprofit organizations. Use the following results:
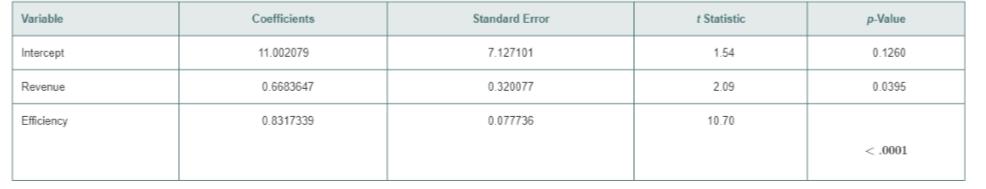
a. Construct 95% confidence
b. At the 0.05 level of significance, determine whether each independent variable makes a significant contribution to the regressions model. On the basis of these results, indicate the independent variables to include in this model.
Expert Solution & Answer

Trending nowThis is a popular solution!

Students have asked these similar questions
Consider a linear regression model that relates school expenditures and family background to student performance in Massachusetts using 224 school districts. The response variable is the mean score on the MCAS (Massachusetts Comprehensive Assessment System) exam given in May 1998 to 10th-graders. Four explanatory variables are used: (1) STR is the student-to-teacher ratio, (2) TSAL is the average teacher’s salary, (3) INC is the median household income, and (4) SGL is the percentage of single family households. The Excel Regression output for the sample regression equation is given below.
(a) What proportion of the variation in MCAS score is explained by the explanatory variables?
(b) At the 5% level, are the explanatory variables jointly significant in explaining MCAS score? Explain briefly.
(c) At the 5% level, which variables are individually significant at predicting MCAS score? Explain briefly.
(d) Suppose a second regression model (Model 2) was generated using only…
Chapter 14 Solutions
Basic Business Statistics
Ch. 14 - For this problem, use the following multiple...Ch. 14 - For this problem, use the following multiple...Ch. 14 - A nonprofit analyst seeks to determine which...Ch. 14 - Profitability remains a challenge for banks and...Ch. 14 - The production of wine is a multibillion-dollar...Ch. 14 - Human resource managers face the business problem...Ch. 14 - Prob. 7PSCh. 14 - Prob. 8PSCh. 14 - The following ANOVA summary table is for a...Ch. 14 - The following ANOVA summary table is for a...
Ch. 14 - A financial analyst engaged in business valuation...Ch. 14 - In Problem 14.3 on page 541, you predicted...Ch. 14 - In Problem 14.5 on page 542, you used the...Ch. 14 - In Problem 14.4 on page 541, you used efficiency...Ch. 14 - In Problem 14.7 on page 542, you used the weekly...Ch. 14 - Prob. 16PSCh. 14 - Prob. 17PSCh. 14 - Prob. 18PSCh. 14 - In Problem 14.5 on page 542, you used the...Ch. 14 - Prob. 20PSCh. 14 - Prob. 21PSCh. 14 - Prob. 22PSCh. 14 - Prob. 23PSCh. 14 - Prob. 24PSCh. 14 - In Problem 14.3 on page 541, you predicted...Ch. 14 - In Problem on page 541, you used efficiency ratio...Ch. 14 - Prob. 27PSCh. 14 - In Problem 14.6 on page 542, you used full-time...Ch. 14 - Prob. 29PSCh. 14 - Prob. 30PSCh. 14 - The following is the ANOVA summary table for a...Ch. 14 - The following is the ANOVA summary table for a...Ch. 14 - In Problem 14.5 on page 542, you used alcohol...Ch. 14 - In Problem 14.4 on page 541, you used efficiency...Ch. 14 - Prob. 35PSCh. 14 - In Problem 14.6 on page 542, you used full-time...Ch. 14 - Prob. 37PSCh. 14 - Suppose X1 is a numerical variable and X2 is a...Ch. 14 - The chair of the accounting department plans to...Ch. 14 - A real estate association in a suburban community...Ch. 14 - In Problem 14.5 on page 542, you developed a...Ch. 14 - In mining engineering, holes are often drilled...Ch. 14 - The owner of a moving company typically has his...Ch. 14 - Prob. 44PSCh. 14 - Zagat’s publishes restaurant rating for various...Ch. 14 - In Problem 14.6 on page 542, you used full-time...Ch. 14 - In Problem 14.5 on page 542, the percentage of...Ch. 14 - Prob. 48PSCh. 14 - The director of a training program for a large...Ch. 14 - Prob. 50PSCh. 14 - Prob. 51PSCh. 14 - Prob. 52PSCh. 14 - Prob. 53PSCh. 14 - Prob. 54PSCh. 14 - Prob. 55PSCh. 14 - Prob. 56PSCh. 14 - Prob. 57PSCh. 14 - An automotive insurance company wants to predict...Ch. 14 - A marketing manager wants to predict customer with...Ch. 14 - A local supermarket manager wants to use two...Ch. 14 - Prob. 61PSCh. 14 - Prob. 62PSCh. 14 - Prob. 63PSCh. 14 - Prob. 64PSCh. 14 - Prob. 65PSCh. 14 - Prob. 66PSCh. 14 - Prob. 67PSCh. 14 - Prob. 68PSCh. 14 - Prob. 69PSCh. 14 - Prob. 70PSCh. 14 - Prob. 71PSCh. 14 - The owner of a moving company typically has his...Ch. 14 - Professional basketball has truly become a sport...Ch. 14 - A sample of 61 house recently listed for sale in...Ch. 14 - Measuring the height of a California redwood tree...Ch. 14 - A sample of 61 houses recently listed for sale in...Ch. 14 - Prob. 77PSCh. 14 - Referring to Problem 14.77, Suppose that an...Ch. 14 - Prob. 79PSCh. 14 - Prob. 80PSCh. 14 - Prob. 81PSCh. 14 - Prob. 82PSCh. 14 - Prob. 83PS
Knowledge Booster


Learn more about
Need a deep-dive on the concept behind this application? Look no further. Learn more about this topic, statistics and related others by exploring similar questions and additional content below.Similar questions
- Olympic Pole Vault The graph in Figure 7 indicates that in recent years the winning Olympic men’s pole vault height has fallen below the value predicted by the regression line in Example 2. This might have occurred because when the pole vault was a new event there was much room for improvement in vaulters’ performances, whereas now even the best training can produce only incremental advances. Let’s see whether concentrating on more recent results gives a better predictor of future records. (a) Use the data in Table 2 (page 176) to complete the table of winning pole vault heights shown in the margin. (Note that we are using x=0 to correspond to the year 1972, where this restricted data set begins.) (b) Find the regression line for the data in part ‚(a). (c) Plot the data and the regression line on the same axes. Does the regression line seem to provide a good model for the data? (d) What does the regression line predict as the winning pole vault height for the 2012 Olympics? Compare this predicted value to the actual 2012 winning height of 5.97 m, as described on page 177. Has this new regression line provided a better prediction than the line in Example 2?arrow_forwardWhat does the y -intercept on the graph of a logistic equation correspond to for a population modeled by that equation?arrow_forwardThe St. Lucian Government is interested in predicting the number of weekly riders on the public buses using the following variables: • • • • Price of bus trips per weekThe population in the cityThe monthly income of ridersAverage rate to park your personal vehicle Determine the multiple regression equation for the data. What is the predicted value of the number of weekly riders if: price of bus trips per week = $24; population = $2,000,000; the monthly income of riders = $13,500; and average rate to park your personal vehicle = $150. Interpret the coefficient of determination.arrow_forward
- D& T LTD marketing team needed more information about the effectiveness of their 3 main mode of advertising. To determine which type is the most effective, the manager collected one week’s data from 25 randomly selected stores. For each store, the following variables were recorded: Weekly gross sales Weekly expenditure on direct mailing (Direct) Weekly expenditure on newspaper advertising (Newspaper) Weekly expenditure on television commercials (Television) Following is the regression output based on the above-mentioned data. SUMMARY OUTPUT Regression Statistics Multiple R 0.442…arrow_forwardYou have data on 945 teenage girls, all below the age of 20. The data contain an indicator for whether teenage girls know about contraceptive methods (contraceptive). You are interested in estimating the causal effect of completing compulsory school on the likelihood that young girls know about contraceptive methods. You observe an indicator for completing compulsory school (compulsory), as well as age, and an dummy variable indicating residence in an urban area. Consider the following regression: contraceptive = Bo + B1age + B2age² + Bzurban + Bạcompul sory + u You are concerned that the indicator for compulsory school is correlated with the error term. The data set contains an indicator for being born in the first quarter of the year (quarter1). Birth month determines age of first entry into school in the USA. Individuals born in the first quarter of the year start school after turning 6. Since it is legal to drop out of school at age 16, this implies that these individuals can drop…arrow_forwardThe following table shows the starting salary and profile of a sample of 10 employees in a certain call center agency. Run a multiple regression analysis with starting salary as the dependent variable (pesos) and GPA, years of experience and civil service ratings as the independent variables. Use .05 level of significance. Based on the multiple regression output, if GPA and civil service ratings are held fixed, how much is the expected increase in the starting salary (pesos) for every one year increase in the years of experience? avil Years of Starting salary GPA service experience ratings 79.5 78.0 79.0 80.0 15000 80.1 1 15000 81.2 1 15500 81.3 2 16000 82.4 3 16200 83.4 17500 87.9 18000 90.3 16,300 84.2 17000 87.0 17900 88.1 85.0 89.9 89.1 4 3 84.1 89.0 89.2 4 Php 291.50 Php 296.50 Php 396.39 Php 94.76arrow_forward
- The regional transit authority for a major metropolitan area wants to determine whetherthere is a relationship between the age of a bus and the annual maintenance cost. A sampleof ten buses resulted in the following data: a. Develop a scatter chart for these data. What does the scatter chart indicate about therelationship between age of a bus and the annual maintenance cost?b. Use the data to develop an estimated regression equation that could be used to predictthe annual maintenance cost given the age of the bus. What is the estimated regressionmodel?c. Test whether each of the regression parameters b0 and b1 is equal to zero at a 0.05level of significance. What are the correct interpretations of the estimated regressionparameters? Are these interpretations reasonable?d. How much of the variation in the sample values of annual maintenance cost does themodel you estimated in part b explain?e. What do you predict the annual maintenance cost to be for a 3.5-year-old bus?arrow_forwardSuppose that you have several hypotheses to test, as follow:H1: Costumer focus has a significant positive relationship with organization performance.H2: Continuous improvement has a significant negative relationship with organization performance.H3: Employee involvement has a significant negative relationship with organization performance.H4: Top management support has a significant positive relationship with organization performance.H5: Supplier management has a significant positive relationship with organization performance.After you analyze the data using linear regression analysis, the result showed as follow: MODEL SUMMARY Model R R Square Adjusted R Square Std. Error of the Estimate 1 .674a 0.579 0.467 0.833 ANNOVA Model Sum of Squares df Mean Square F Sig. Regression 85.400 6 13.673 23.547 .000b Residual 140.500 195 .695 Total 218.500 198 a. Dependent Variable: Organization Performance b. Predictors: (Constant), Customer focus,…arrow_forwardA small independent organic food store offers a variety of specialty coffees. To determine whether price has an impact on sales, the managers kept track of how many kilograms of each variety of coffee were sold last month. The data and summary statistics (including the averages, standard deviations and the correlation coefficient) are shown in the table. If the "price per kilogram" is the predictor variable and "kilograms sold" is the response variable, then use a regression line to predict the the amount of kilograms sold for a "price per kilogram" equal to $15. Round your numbers to 3 decimal places.arrow_forward
- Using data from the 2008 General Social Survey (GSS), political psychologists were interested in whether speaking a language other than English (1=yes, 2=no) and political views (1=extremely liberal, 7=extremely conservative) would predict attitudes toward the number of immigrants there should be in the United States (1=should be increased a lot, 5=should be reduced a lot). Write out the regression model and explain what the bs and a mean. Which predictor variable contributed more to the model? Show evidence.arrow_forwardThe Transactional Records Access Clearinghouse at Syracuse University reported data showing the odds of an Internal Revenue Service audit. The following table shows the average adjusted gross income reported and the percent of the returns that were audited for 20 selected IRS districts. Develop the estimated regression equation that could be used to predict the percent audited given the average adjusted gross income reported. At the .05 level of significance, determine whether the adjusted gross income and the percent audited are related. Did the estimated regression equation provide a good fit? District Adjusted Gross Income ($) Percent Audited Los Angeles 36,664 1.3 Sacramento 38,845 1.1 Atlanta 34,886 1.1 Boise 32,512 1.1 Dallas 34,531 1.0 Providence 35,995 1.0 San Jose 37,799 0.9 Cheyenne 33,876 0.9 Fargo 30,513 0.9 New Orleans 30,174 0.9 Oklahoma City 30,060 0.8 Houston 37,153…arrow_forwardWhat is the differed annual expenditures of two families if their annual net incomes are differed by 2000? The computed regression line has a value of a=4.32 and b=2.12.arrow_forward
arrow_back_ios
arrow_forward_ios
Recommended textbooks for you
 College AlgebraAlgebraISBN:9781305115545Author:James Stewart, Lothar Redlin, Saleem WatsonPublisher:Cengage Learning
 Linear Algebra: A Modern IntroductionAlgebraISBN:9781285463247Author:David PoolePublisher:Cengage Learning
 Glencoe Algebra 1, Student Edition, 9780079039897...AlgebraISBN:9780079039897Author:CarterPublisher:McGraw Hill
 Algebra and Trigonometry (MindTap Course List)AlgebraISBN:9781305071742Author:James Stewart, Lothar Redlin, Saleem WatsonPublisher:Cengage Learning
 Big Ideas Math A Bridge To Success Algebra 1: Stu...AlgebraISBN:9781680331141Author:HOUGHTON MIFFLIN HARCOURTPublisher:Houghton Mifflin Harcourt
College Algebra
Algebra
ISBN:9781305115545
Author:James Stewart, Lothar Redlin, Saleem Watson
Publisher:Cengage Learning
Linear Algebra: A Modern Introduction
Algebra
ISBN:9781285463247
Author:David Poole
Publisher:Cengage Learning
Glencoe Algebra 1, Student Edition, 9780079039897...
Algebra
ISBN:9780079039897
Author:Carter
Publisher:McGraw Hill
Algebra and Trigonometry (MindTap Course List)
Algebra
ISBN:9781305071742
Author:James Stewart, Lothar Redlin, Saleem Watson
Publisher:Cengage Learning
Big Ideas Math A Bridge To Success Algebra 1: Stu...
Algebra
ISBN:9781680331141
Author:HOUGHTON MIFFLIN HARCOURT
Publisher:Houghton Mifflin Harcourt
Time Series Analysis Theory & Uni-variate Forecasting Techniques; Author: Analytics University;https://www.youtube.com/watch?v=_X5q9FYLGxM;License: Standard YouTube License, CC-BY
Operations management 101: Time-series, forecasting introduction; Author: Brandoz Foltz;https://www.youtube.com/watch?v=EaqZP36ool8;License: Standard YouTube License, CC-BY