
Concept explainers
Videos
Example 1.5 gave the accompanying data on violent crime on public college campuses in Florida during 2016 (fbi.gov, retrieved February 6, 2018):
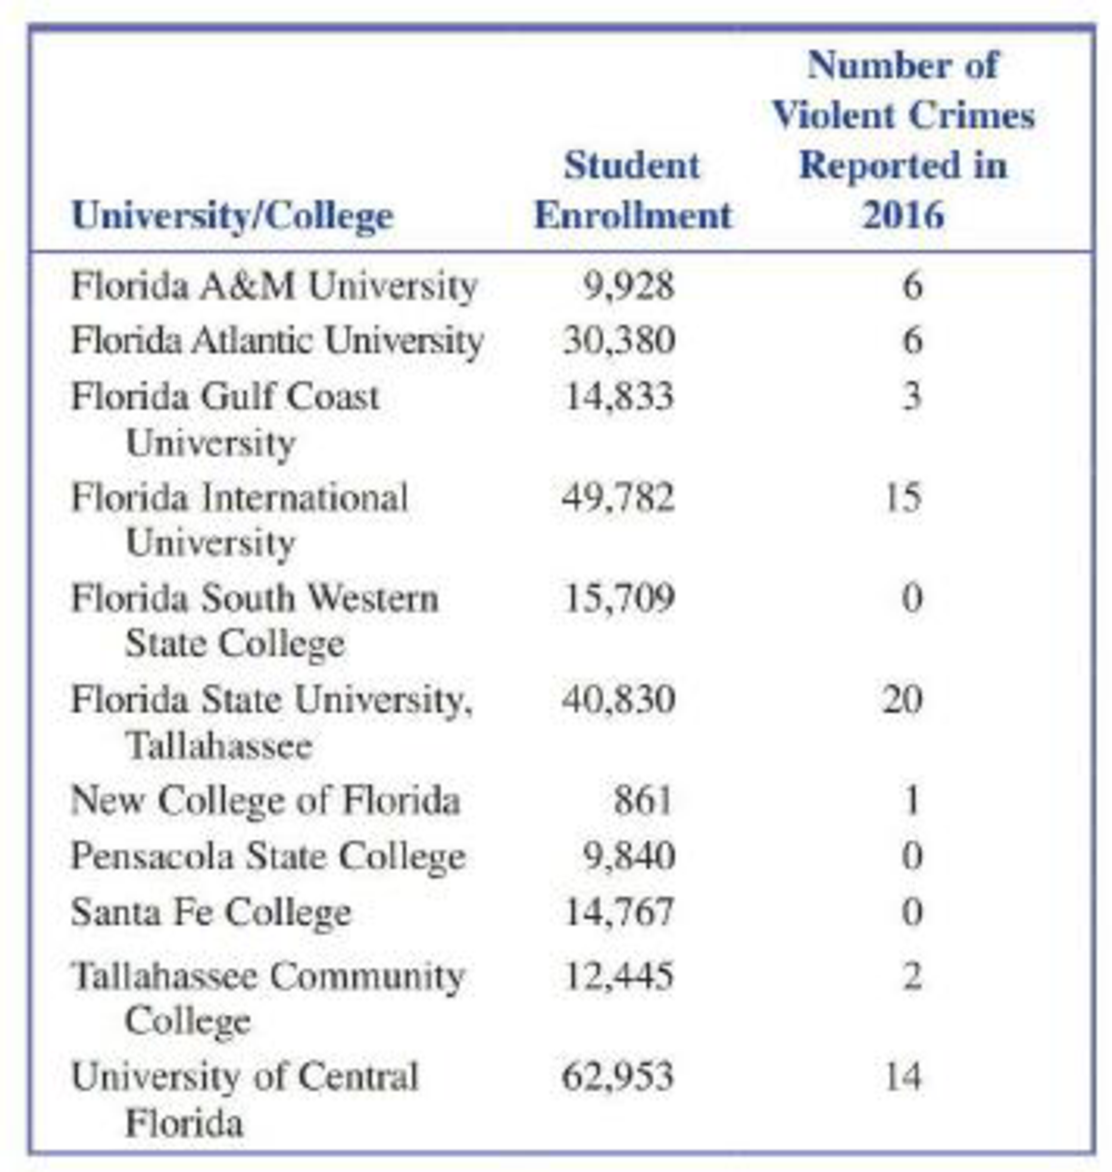
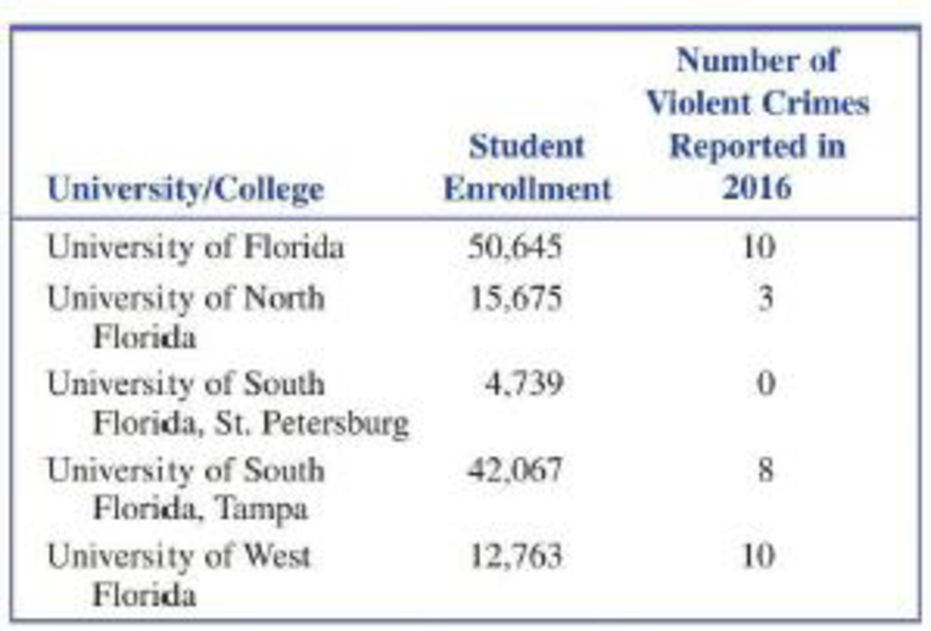
- a. Construct a dotplot using the 16 observations on number of violent crimes reported. Which schools stand out from the rest?
- b. One of the Florida schools has only 861 students and a few of the schools are quite a bit larger than the rest. Because of this, it might make more sense to consider a crime rate by calculating the number of violent crimes reported per 1000 students. For example, for Florida A&M University the violent crime rate would be
Calculate the violent crime rate for the other 15 schools and then use those values to construct a dotplot. Do the same schools stand out as unusual in this dotplot?
- c. Based on your answers from Parts (a) and (b), write a couple of sentences commenting on violent crimes reported at Florida universities and colleges in 2016.
a.
Draw a dot plot using the 16 observations on number of violent crimes reported.
Find the schools that stand out from the rest.
Answer to Problem 27E
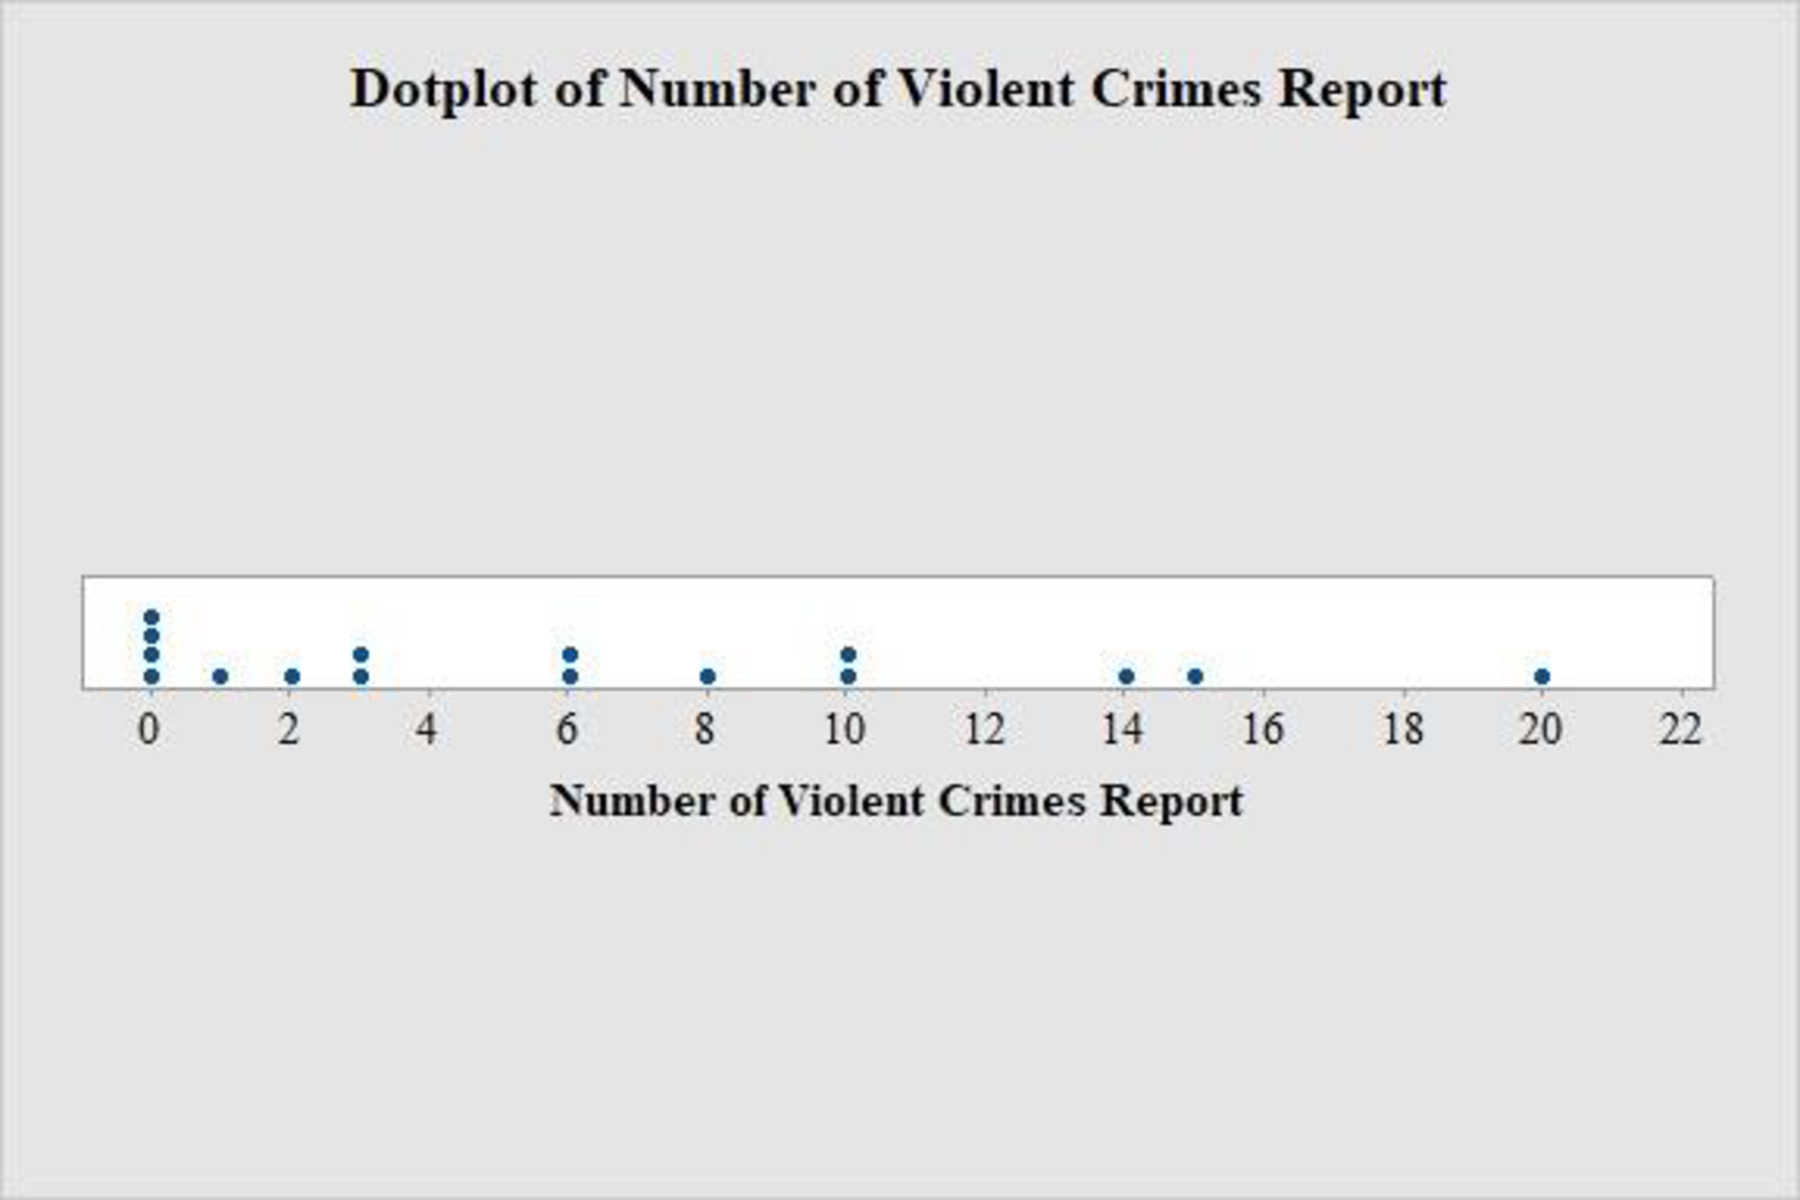
The dot plot using the 16 observations on number of violent crimes reported is given below:
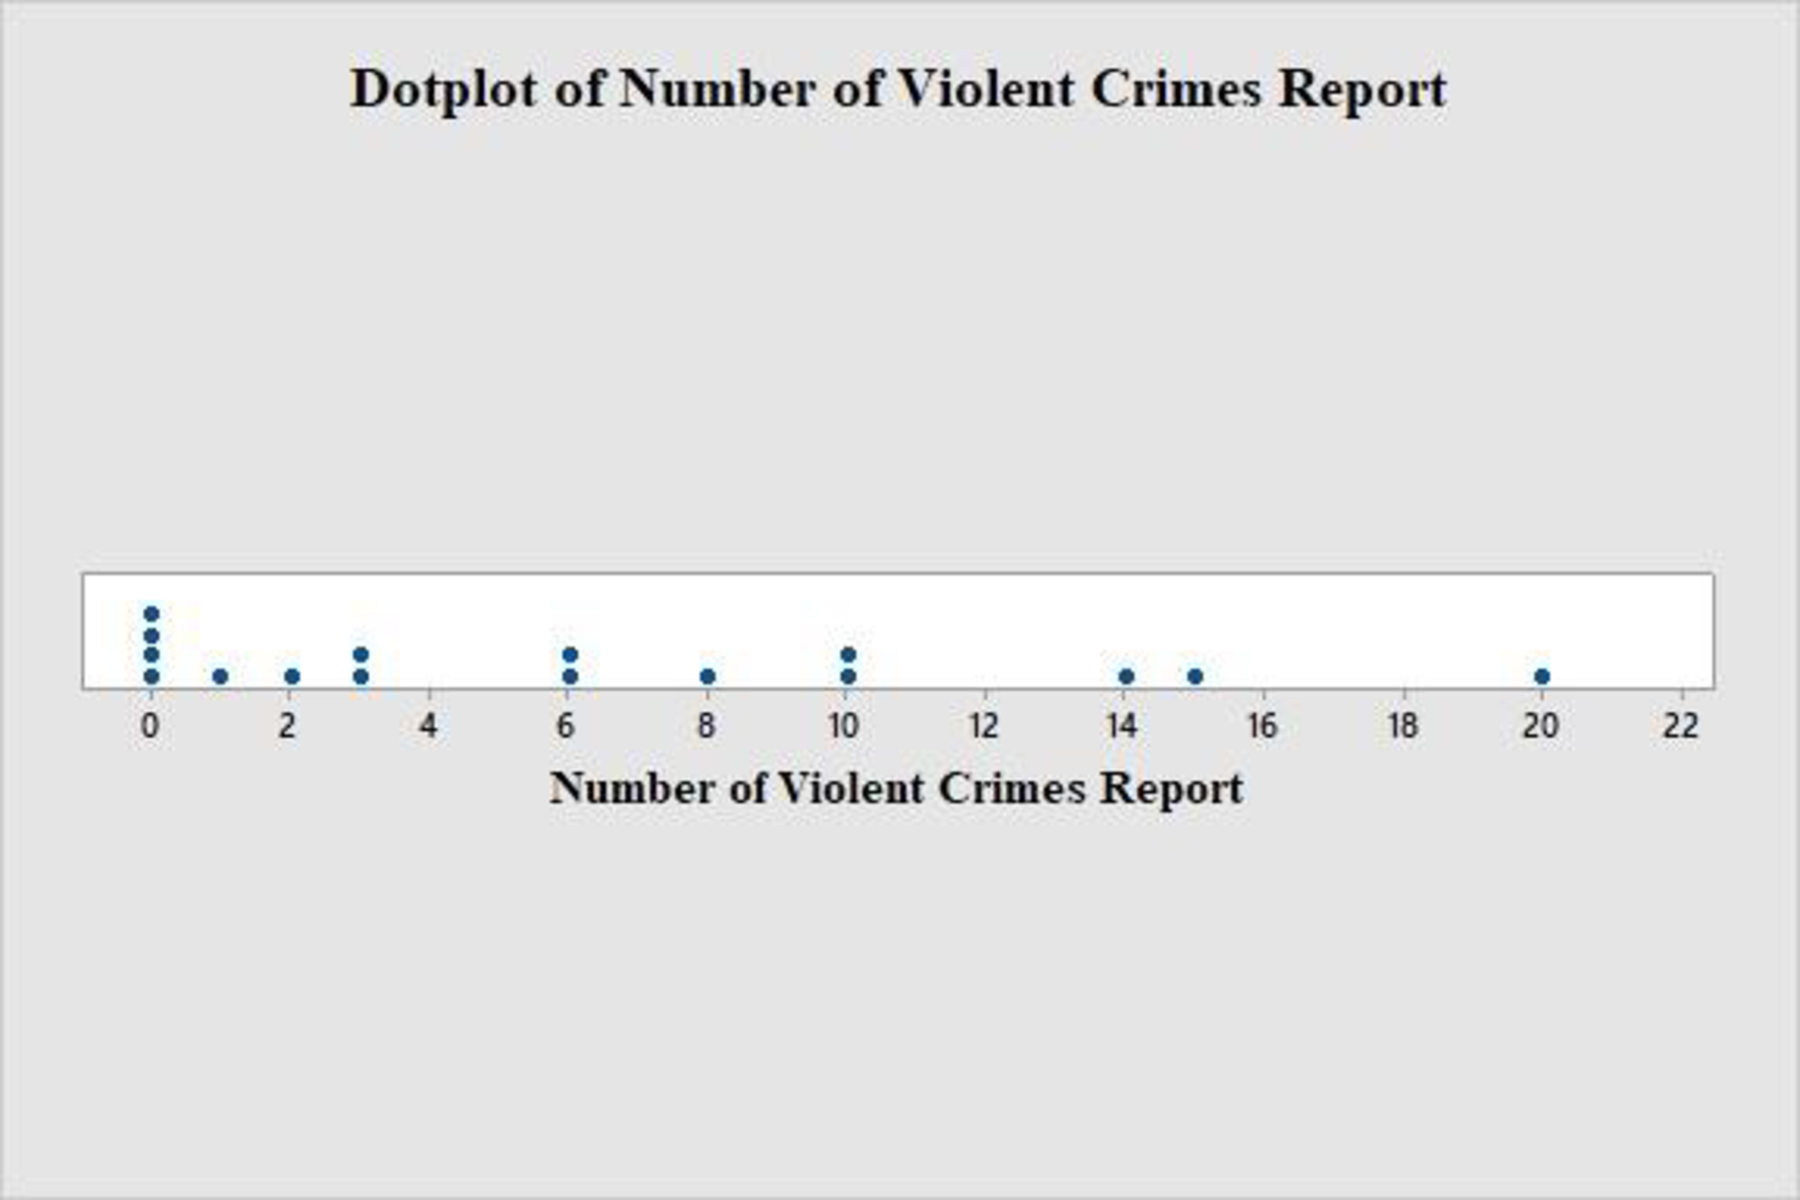
University of Central Florida, Florida International University and Florida State University are stand out from the rest.
Explanation of Solution
Calculation:
The data represents the number of violent crimes reported in 2016 on public college campuses in Florida.
Software procedure:
Step by step procedure to obtain dot-plot using MINITAB software is given below:
- Choose Graph > Dot plot.
- Choose One Y, select simple and then click OK.
- In Graph variables, enter the column of Number of Violent Crimes Report.
- Click OK.
Observation: From the dot plot, it can be observed that three schools stand out from the rest, since higher number of crimes is reported in these schools compared to the rest.
Thus, the schools University of Central Florida, Florida International University and Florida State University are stand out from the rest.
b.
Find the violent crime rate for the other 15 schools and then draw a dot plot using these values.
Check whether the same schools stand out as unusual in this plot.
Answer to Problem 27E
The violent crime rates for the other 15 schools are as follows:
| University/College | Violent Crime Rate Per 1,000 Students |
| Florida A&M University | 0.60435 |
| Florida Atlantic University | 0.19750 |
| Florida Gulf Coast University | 0.20225 |
| Florida International University | 0.301310 |
| Florida South Western State College | 0 |
| Florida State University, Tallahassee | 0.48984 |
| New College of Florida | 1.161441 |
| Pensacola State College | 0 |
| Santa Fe College | 0 |
| Tallahassee Community College | 0.16071 |
| University of Central Florida | 0.22239 |
| University of Florida | 0.19745 |
| University of North Florida | |
| University of South Florida, St. Petersburg | 0 |
| University of South Florida, Tampa | 0.19017 |
| University of West Florida | 0.783510 |
The dot plot using the 16 observations on violent crime rate is given below:
The schools stand out as unusual are not same.
Explanation of Solution
It is given that the violent crime rate for Florida A&M University is calculated as follows:
Then the violent crime rates for the other 15 schools are obtained as follows:
| University/College | Violent Crime Rate Per 1,000 Students |
| Florida A&M University | |
| Florida Atlantic University | |
| Florida Gulf Coast University | |
| Florida International University | |
| Florida South Western State College | |
| Florida State University, Tallahassee | |
| New College of Florida | |
| Pensacola State College | |
| Santa Fe College | |
| Tallahassee Community College | |
| University of Central Florida | |
| University of Florida | |
| University of North Florida | |
| University of South Florida, St. Petersburg | |
| University of South Florida, Tampa | |
| University of West Florida |
Software procedure:
Step by step procedure to obtain dot-plot using MINITAB software is given below:
- Choose Graph > Dot plot.
- Choose One Y, select simple and then click OK.
- In Graph variables, enter the column of Number of Violent Crimes Report.
- Click OK.
Observation: From the dot plot, it can be observed that the schools Florida State University, Florida A&M University and University of West Florida and New College of Florida stand out from the rest, since it has high crime rate than other schools.
Thus, the schools stand out as unusual are not same.
c.
Comment on the violent crimes reported at Florida universities and college in 2016 based on the part (a) and (b).
Explanation of Solution
From part (a), it can be observed that there are three schools that stand out from the rest since these schools have higher number of crimes compared to the rest. However, majority of schools have almost similar and low number of crimes.
From part (b), it can be observed that there are four schools that stand out from the rest since these schools have higher crime rate compared to the rest. Also there are four schools having low crime rate that also stand out from the rest.
Want to see more full solutions like this?
Chapter 1 Solutions
INTRODUCTION TO STATISTICS & DATA ANALYS


 Linear Algebra: A Modern IntroductionAlgebraISBN:9781285463247Author:David PoolePublisher:Cengage Learning
 Big Ideas Math A Bridge To Success Algebra 1: Stu...AlgebraISBN:9781680331141Author:HOUGHTON MIFFLIN HARCOURTPublisher:Houghton Mifflin Harcourt