
INTRODUCTION TO STATISTICS & DATA ANALYS
6th Edition
ISBN: 9780357420447
Author: PECK
Publisher: CENGAGE L
expand_more
expand_more
format_list_bulleted
Concept explainers
Videos
Textbook Question
Chapter 1.4, Problem 26E
The U.S. Department of Health and Human Services reported the estimated percentage of households with only wireless phone service (no landline) in 2014 for the 50 states and the District of Columbia (cdc.gov/nchs/data/nhis/earlyrelease/wireless_state_201602.
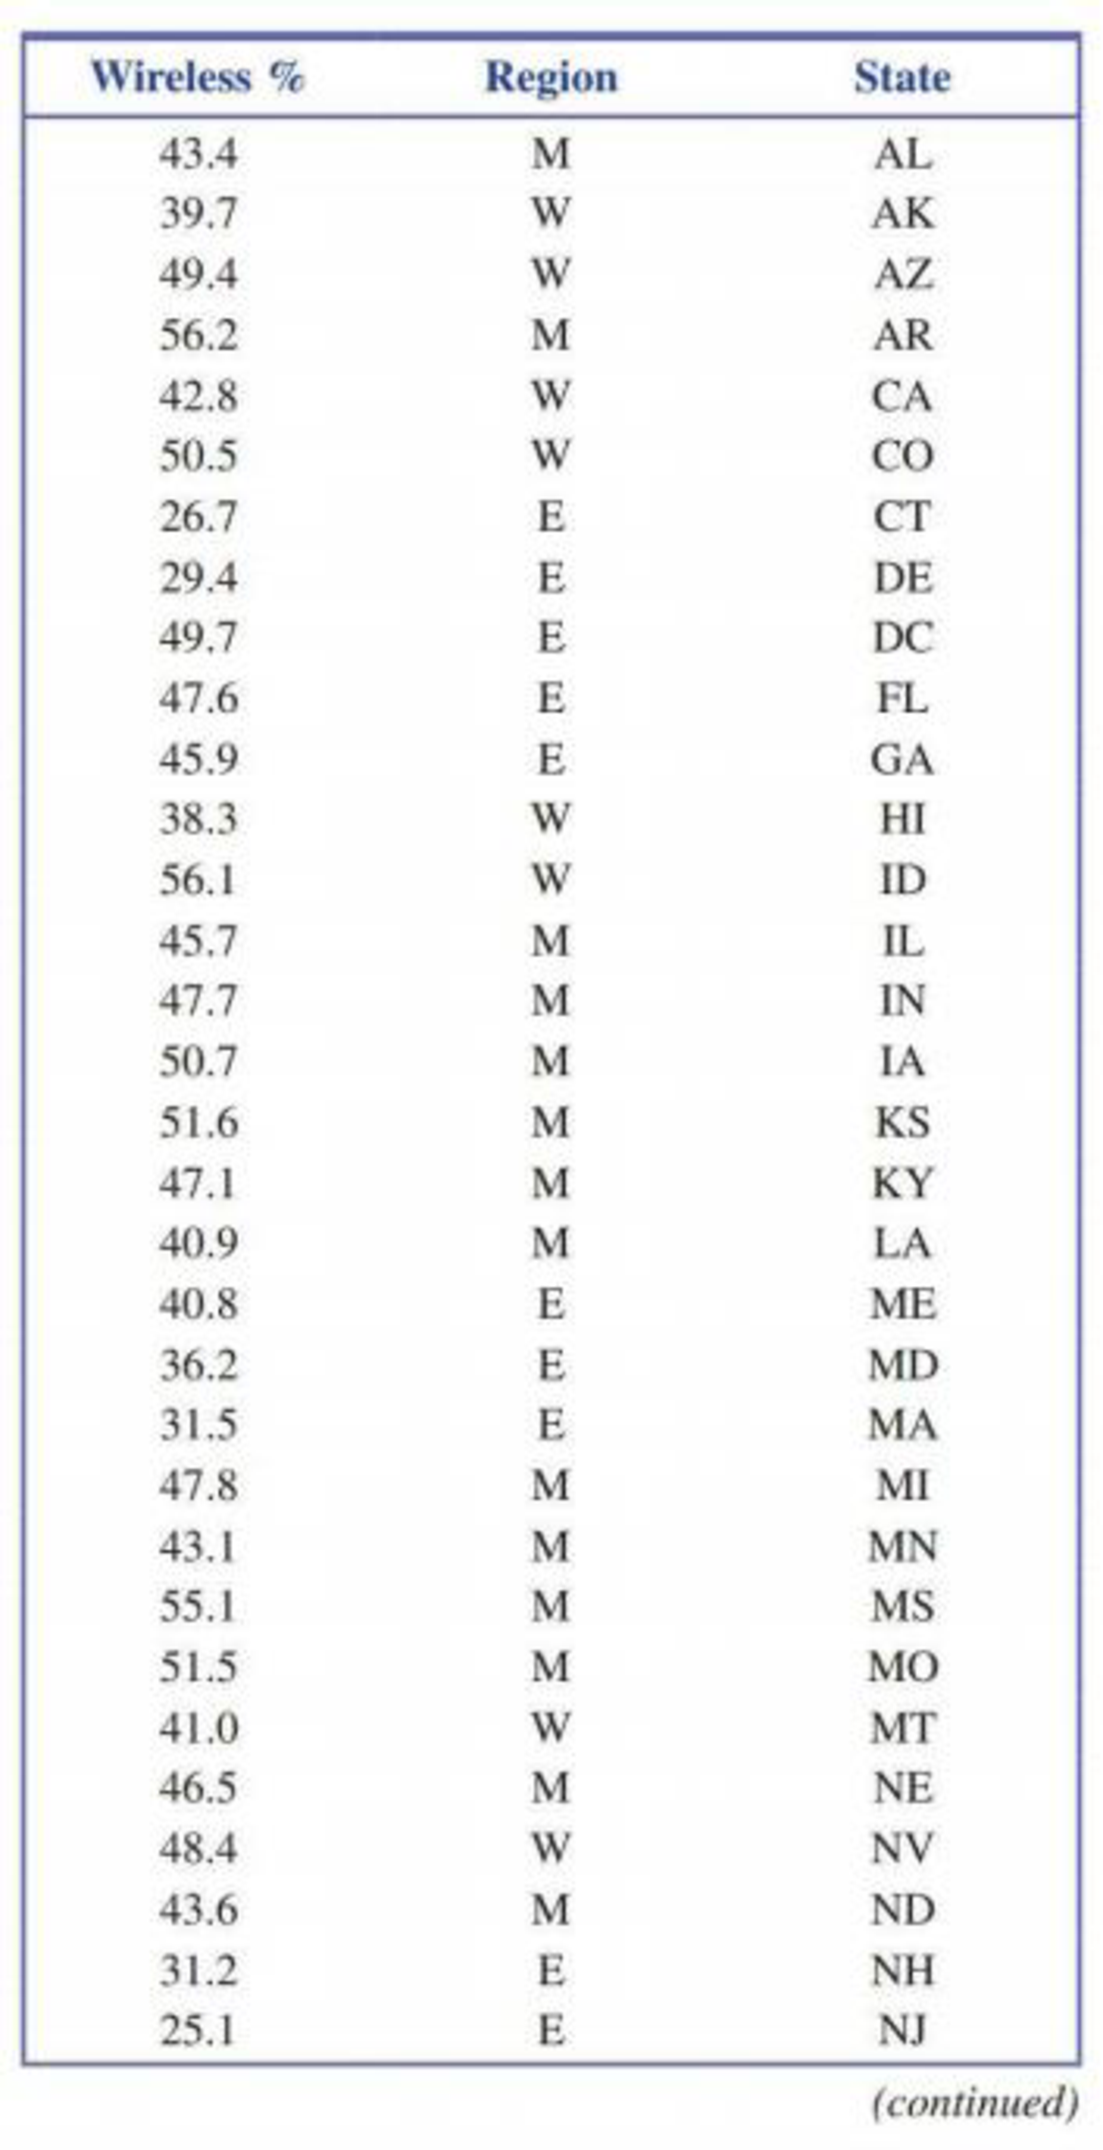
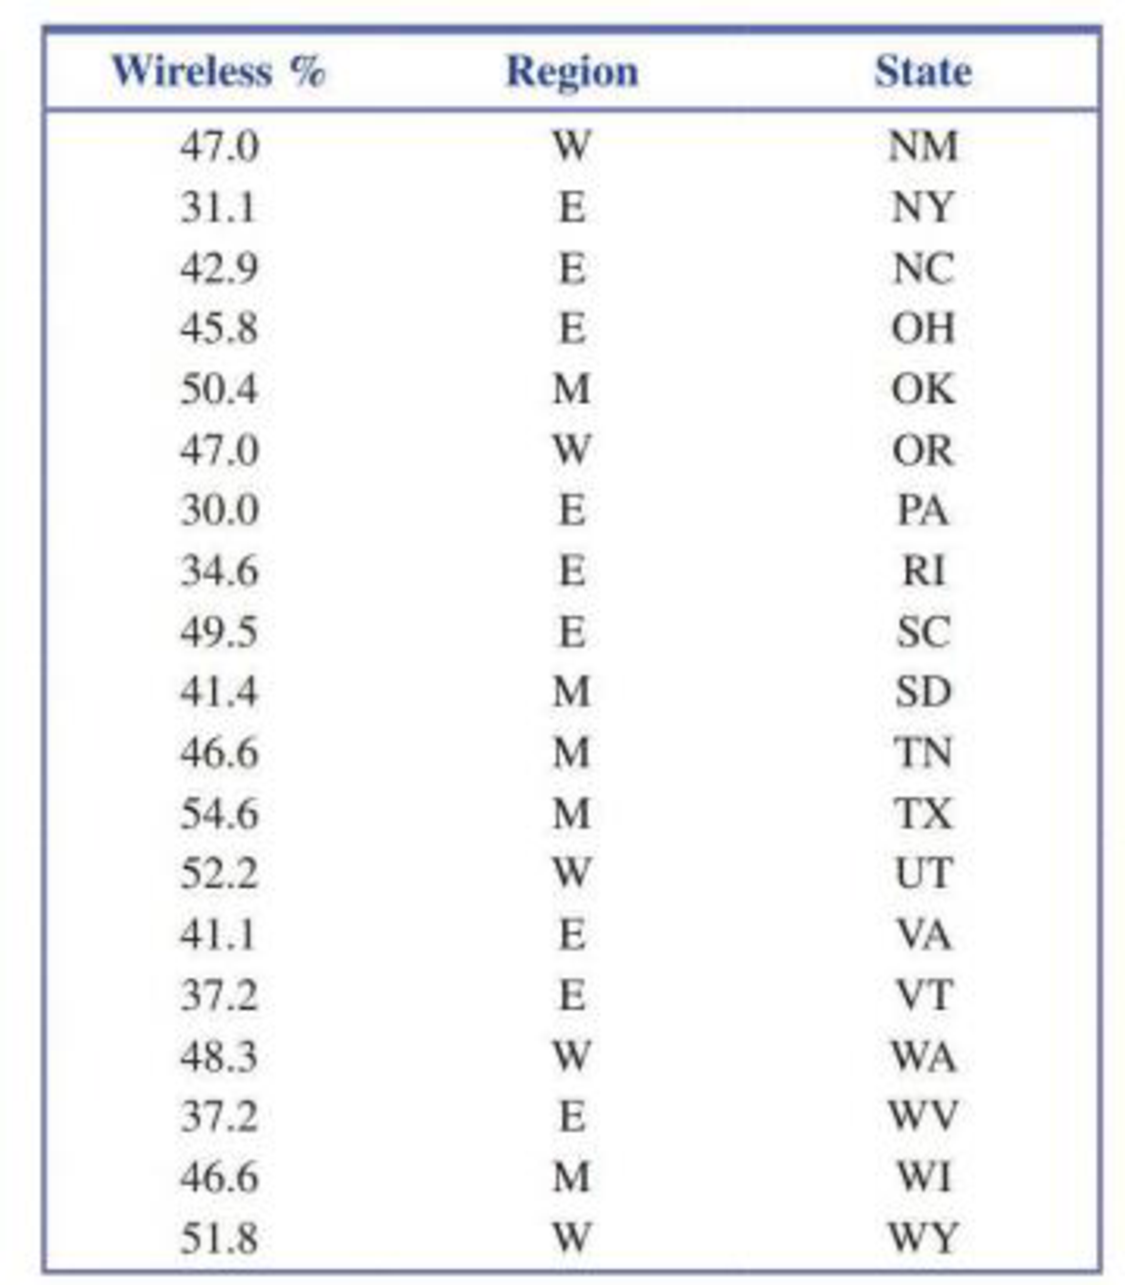
- a. Display the data graphically in a way that makes it possible to compare wireless percent for the three geographical regions.
- b. Does the graphical display in Part (a) reveal any striking differences in w ireless percent for the three geographical regions or are the distributions of wireless percent observations similar for the three regions?
Expert Solution & Answer
Want to see the full answer?
Check out a sample textbook solution
Students have asked these similar questions
The National Center for Education Statistics reported that 47% of college students work to pay for tuition and living expenses. Assume that a sample of 450 college students was used in the study.
According to the February 2008 Federal Trade Commission report on consumer fraud and identity theft, 23% of all complaints in 2007 were for identity theft. In that year, assume some state had 454 complaints of identity theft out of 1660 consumer complaints. Do these data provide enough evidence to show that the state had a higher proportion of identity theft than 23%? Test at the 10% level.
In order to compare the real estate markets in Pittsburgh and Philadelphia, a realtor selected a random sample of 150 homes in the Pittsburgh area and 100 homes in the Philadelphia area. Shown below are dotplots showing the distribution of home price for the homes in these two cities.
Chapter 1 Solutions
INTRODUCTION TO STATISTICS & DATA ANALYS
Ch. 1.3 - Give brief definitions of the terms descriptive...Ch. 1.3 - Give brief definitions of the terms population and...Ch. 1.3 - The following conclusion from a study appeared in...Ch. 1.3 - Based on a study of 2 121 children between the...Ch. 1.3 - The student senate at a university with 15,000...Ch. 1.3 - The National Retail Federation used data from a...Ch. 1.3 - The supervisors of a rural county are interested...Ch. 1.3 - A consumer group conducts crash tests of new model...Ch. 1.3 - A building contractor has a chance to buy an odd...Ch. 1.3 - The article Brain Shunt Tested to Treat Alzheimers...
Ch. 1.3 - In a study of whether taking a garlic supplement...Ch. 1.4 - Classify each of the following variables as either...Ch. 1.4 - Classify each of the following variables as either...Ch. 1.4 - For the following numerical variables, state...Ch. 1.4 - For the following numerical variables, state...Ch. 1.4 - For each of the following situations, give a set...Ch. 1.4 - In a survey of 100 people who had recently...Ch. 1.4 - The Gallup report More Americans Say Real Estate...Ch. 1.4 - An article in the New Times San Luis Obispo...Ch. 1.4 - Box Office Mojo (boxofficemojo.com) tracks movie...Ch. 1.4 - The report With Their Whole Lives Ahead of Them...Ch. 1.4 - The following display is a graph similar to one...Ch. 1.4 - The accompanying table gives the total number...Ch. 1.4 - Heal the Bay is an environmental organization that...Ch. 1.4 - The report referenced in the previous exercise...Ch. 1.4 - The U.S. Department of Health and Human Services...Ch. 1.4 - Example 1.5 gave the accompanying data on violent...Ch. 1.4 - The article Fliers Trapped on Tarmac Push for...Ch. 1.4 - The report Trends m Community Colleges...Ch. 1.4 - The article Where College Students Buy Textbooks...Ch. 1.4 - Prob. 31ECh. 1.4 - In the United States, movies are rated by the...Ch. 1 - The report Testing the Waters 2009 (nrdc.org)...Ch. 1 - The U.S. Department of Education reported that 14%...Ch. 1 - The Computer Assisted Assessment Center at the...Ch. 1 - The article Just How Safe Is That Jet? (USA TODAY,...Ch. 1 - Each year, U.S. News and World Report publishes a...Ch. 1 - Many adolescent boys aspire to be professional...
Knowledge Booster


Learn more about
Need a deep-dive on the concept behind this application? Look no further. Learn more about this topic, statistics and related others by exploring similar questions and additional content below.Similar questions
- What is a sample space?arrow_forwardList the sample space of each experiment. Picking a one-digit numberarrow_forwardThe Consumer Financial Protection Bureau's Consumer Response Team hears directly from consumers about the challenges they face in the marketplace , brings their concerns to the attention of financial institutions , and assists in addressing their complaints . Of the consumers who registered a bank account and service com plaint , 46 % cited " account management , " complaints related to the marketing or management of an account , as their complaint . Source : Consumer Response Annual Report , bit.ly/2x4CN5w . Consider a sample of 20 consumers who registered bank account and service complaints . Use the binomial model to answer the fol lowing questions : a . What is the expected value , or mean , of the binomial distribution ? b . What is the standard deviation of the binomial distribution ? c . What is the probability that 10 of the 20 consumers cited " account management " as the type of complaint ? d . What is the probability that no more than 5 of the consumers cited " account…arrow_forward
- The Hate Crime Statistics Act of 1990 requires the Attorney General to collect national data about crimes that manifest evidence of prejudice based on race, religion, sexualorientation, or ethnicity, including the crimes of murder and non-negligent manslaughter,forcible rape, aggravated assault, simple assault, intimidation, arson, and destruction, dam-age, or vandalism of property. The Hate Crime Data collected in 2005 reveals, based on arandomly selected sample of 500 incidents, that the mean number of victims in a particulartype of hate crime was 2.65, with a standard deviation of 1.22. Assuming that the numberof victims wasnormally distributed, answer the following questions. a) What proportion of crime incidents had more than three victims? b) What is the probability that there was more than one victim in an incident? c) What proportion of crime incidents had less than four victims? d) Construct and interpret an estimate of the population at the 95% level.arrow_forwardAccording to the February 2008 Federal Trade Commission report on consumer fraud and identity theft, 23% of all complaints in 2007 were for identity theft. In that year, Alaska had 321 complaints of identity theft out of 1,432 consumer complaints ("Consumer fraud and," 2008). Does this data provide enough evidence to show that Alaska had a lower proportion of identity theft than 23%? Test at the 5% level.arrow_forwardAccording to Nielsen Inc., the top 20 rated TV shows for 2018, based on the share of the total available audience, are listed here. A researcher believes that viewing habits of viewers who live in the U.S. Pacific Standard Time (PST) zone are not related to the Nielsen shares. The researcher surveyed a random sample of TV viewers in the PST zone and computed a composite ranking for the top 20 TV shows. Nielsen Rank Show Network Share PST ZoneComposite Rank 1 NFL Sunday Night Football NBC 6.2 1 2 This Is Us NBC 5.4 3 3 Roseanne ABC 5 12 4 NFL Thursday Night Football (CBS + NFLN) CBS 4.5 5 5 The Big Bang Theory CBS 4.4 11 6 NFL Sunday Night Football Pre-Kickoff NBC 4.3 14 7 NFL Thursday Night Football (NBC + NFLN) NBC 4 19 8 The OT Fox 3.8 16 9 The Good Doctor ABC 3.4 7 10 Young Sheldon CBS 3.3 6 11 Grey's Anatomy ABC 3.2 13 12 Football Night in America 3 NBC 3.1 8 13 9-1-1 Fox 3 2 14 Will & Grace NBC 2.8 9 15 Empire Fox 2.6 20 16 The Voice NBC 2.5…arrow_forward
- According to Nielsen Inc., the top 20 rated TV shows for 2018, based on the share of the total available audience, are listed here. A researcher believes that viewing habits of viewers who live in the U.S. Pacific Standard Time (PST) zone are not related to the Nielsen shares. The researcher surveyed a random sample of TV viewers in the PST zone and computed a composite ranking for the top 20 TV shows. Nielsen Rank Show Network Share PST ZoneComposite Rank 1 NFL Sunday Night Football NBC 6.2 1 2 This Is Us NBC 5.4 3 3 Roseanne ABC 5 12 4 NFL Thursday Night Football (CBS + NFLN) CBS 4.5 5 5 The Big Bang Theory CBS 4.4 11 6 NFL Sunday Night Football Pre-Kickoff NBC 4.3 14 7 NFL Thursday Night Football (NBC + NFLN) NBC 4 19 8 The OT Fox 3.8 16 9 The Good Doctor ABC 3.4 7 10 Young Sheldon CBS 3.3 6 11 Grey's Anatomy ABC 3.2 13 12 Football Night in America 3 NBC 3.1 8 13 9-1-1 Fox 3 2 14 Will & Grace NBC 2.8 9 15 Empire Fox 2.6 20 16 The Voice NBC 2.5…arrow_forwardAccording to Nielsen Inc., the top 20 rated TV shows for 2018, based on the share of the total available audience, are listed here. A researcher believes that viewing habits of viewers who live in the U.S. Pacific Standard Time (PST) zone are not related to the Nielsen shares. The researcher surveyed a random sample of TV viewers in the PST zone and computed a composite ranking for the top 20 TV shows. Nielsen Rank Show Network Share PST ZoneComposite Rank 1 NFL Sunday Night Football NBC 6.2 1 2 This Is Us NBC 5.4 3 3 Roseanne ABC 5 12 4 NFL Thursday Night Football (CBS + NFLN) CBS 4.5 5 5 The Big Bang Theory CBS 4.4 11 6 NFL Sunday Night Football Pre-Kickoff NBC 4.3 14 7 NFL Thursday Night Football (NBC + NFLN) NBC 4 19 8 The OT Fox 3.8 16 9 The Good Doctor ABC 3.4 7 10 Young Sheldon CBS 3.3 6 11 Grey's Anatomy ABC 3.2 13 12 Football Night in America 3 NBC 3.1 8 13 9-1-1 Fox 3 2 14 Will & Grace NBC 2.8 9 15 Empire Fox 2.6 20 16 The Voice NBC 2.5…arrow_forward
arrow_back_ios
arrow_forward_ios
Recommended textbooks for you
 Holt Mcdougal Larson Pre-algebra: Student Edition...AlgebraISBN:9780547587776Author:HOLT MCDOUGALPublisher:HOLT MCDOUGAL
 Glencoe Algebra 1, Student Edition, 9780079039897...AlgebraISBN:9780079039897Author:CarterPublisher:McGraw Hill
 College Algebra (MindTap Course List)AlgebraISBN:9781305652231Author:R. David Gustafson, Jeff HughesPublisher:Cengage Learning
Holt Mcdougal Larson Pre-algebra: Student Edition...
Algebra
ISBN:9780547587776
Author:HOLT MCDOUGAL
Publisher:HOLT MCDOUGAL
Glencoe Algebra 1, Student Edition, 9780079039897...
Algebra
ISBN:9780079039897
Author:Carter
Publisher:McGraw Hill
College Algebra (MindTap Course List)
Algebra
ISBN:9781305652231
Author:R. David Gustafson, Jeff Hughes
Publisher:Cengage Learning
Hypothesis Testing - Solving Problems With Proportions; Author: The Organic Chemistry Tutor;https://www.youtube.com/watch?v=76VruarGn2Q;License: Standard YouTube License, CC-BY
Hypothesis Testing and Confidence Intervals (FRM Part 1 – Book 2 – Chapter 5); Author: Analystprep;https://www.youtube.com/watch?v=vth3yZIUlGQ;License: Standard YouTube License, CC-BY