
CORPORATE FIN.(LL)-W/ACCESS >CUSTOM<
11th Edition
ISBN: 9781260269901
Author: Ross
Publisher: MCG CUSTOM
expand_more
expand_more
format_list_bulleted
Videos
Textbook Question
Chapter 14, Problem 2QP
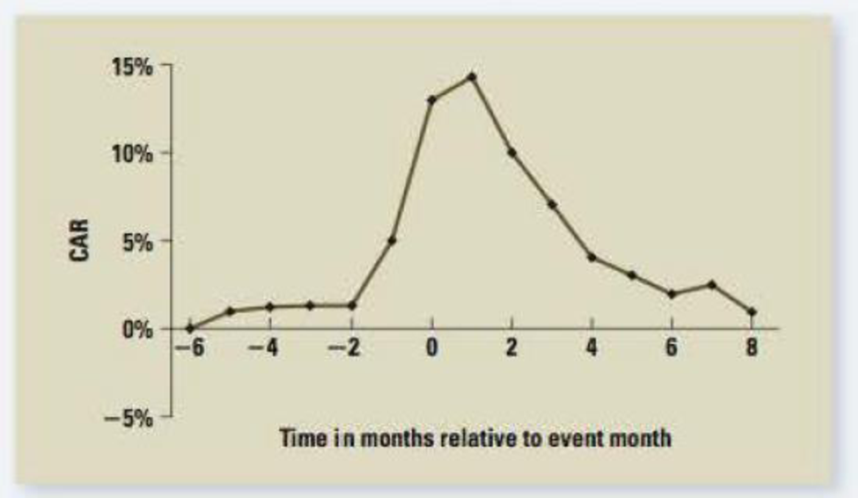
Cumulative Abnormal Returns The following diagram shows the cumulative abnormal returns (CAR) for 386 oil exploration companies announcing oil discoveries between 1950 and 1980. Month 0 in the diagram is the announcement month. Assume that no other information is received and the stock market as a whole does not move. Is the diagram consistent with
Expert Solution & Answer
Want to see the full answer?
Check out a sample textbook solution
Students have asked these similar questions
(Calculating the geometric and arithmetic average rate of return) The common stock of the Brangus Cattle Company had the following end-of-year stock prices over the last five years and paid no cash dividends:
Time Brangus Cattle Company1 $132 $103 $114 $245 $25
a. Calculate the annual rate of return for each year from the above information.
b. What is the arithmetic average rate of return earned by investing in Brangus Cattle Company's stock over this period?
c. What is the geometric average rate of return earned by investing in Brangus Cattle Company's stock over this period?
d. Which type of average rate of return best describes the average annual rate of return earned over the period (the arithmetic or geometric)? Why?
On 3/31/2020, Company ABC released its quarterly report, showing the sales in the first quarter had tumbled 30% as a pandemic hit. However, the stock price for company ABC went up by 3% right after the report was released. Does this mean a failure for the Market Efficient Theory?
a company will generate payoffs to investors the following year which depend on state of economy as follows:
dividend
stock price
boom
$8
$240
normal economy
4
90
recession
0
0
company goes out of business if a recession hits, calculate expected rate of return and standard deviation of return to shareholders and assume for simplicity that the three possible states of the economy are equally likely. The stock selling today goes for $80
Chapter 14 Solutions
CORPORATE FIN.(LL)-W/ACCESS >CUSTOM<
Ch. 14 - Prob. 1CQCh. 14 - Prob. 2CQCh. 14 - Efficient Market Hypothesis Which of the following...Ch. 14 - Market Efficiency Implications Explain why a...Ch. 14 - Efficient Market Hypothesis A stock market analyst...Ch. 14 - Semistrong Efficiency If a market is semistrong...Ch. 14 - Efficient Market Hypothesis What are the...Ch. 14 - Prob. 8CQCh. 14 - Prob. 9CQCh. 14 - Efficient Market Hypothesis For each of the...
Ch. 14 - Technical Analysis What would a technical analyst...Ch. 14 - Prob. 12CQCh. 14 - Prob. 13CQCh. 14 - Efficient Markets A hundred years ago or so,...Ch. 14 - Efficient Market Hypothesis Aerotech, an aerospace...Ch. 14 - Prob. 16CQCh. 14 - Prob. 17CQCh. 14 - Efficient Market Hypothesis Newtech Corp. is going...Ch. 14 - Prob. 19CQCh. 14 - Efficient Market Hypothesis The Durkin Investing...Ch. 14 - Efficient Market Hypothesis Your broker commented...Ch. 14 - Efficient Market Hypothesis A famous economist...Ch. 14 - Efficient Market Hypothesis Suppose the market is...Ch. 14 - Prob. 24CQCh. 14 - Prob. 25CQCh. 14 - Efficient Market Hypothesis Assume that markets...Ch. 14 - Prob. 27CQCh. 14 - Evidence on Market Efficiency Some people argue...Ch. 14 - Prob. 1QPCh. 14 - Cumulative Abnormal Returns The following diagram...Ch. 14 - Cumulative Abnormal Returns The following figures...Ch. 14 - Prob. 4QPCh. 14 - Prob. 1MCCh. 14 - Prob. 2MCCh. 14 - Prob. 3MC
Knowledge Booster


Learn more about
Need a deep-dive on the concept behind this application? Look no further. Learn more about this topic, finance and related others by exploring similar questions and additional content below.Similar questions
- Cambridge Technologies announced on two different occasions that earnings would be less than expected for a particular quarter. It also expressed doubt about the next fiscal year. Following the second announcement, the price declined more than 30 percent, and this was after the price had suffered earlier declines. Should an investor interested in owning the stock react quickly to take advantage of the price drop? Why and why not? Give logic for your answer?arrow_forwardBig Rock is listed on the local stock exchange and its stock has had mixed performanceover the last few months. The company’s directors are interested in seeing how BigRock’s performance compares to other companies in the sector.Company Initial Investment $1,000Value End of Year 1 $1,268Value End of Year 2 $1,334Value End of Year 3 $1,105 Calculate the arithmetic mean and the geometric mean over the three-year periodarrow_forwardReturns earned over a given time period are called realized returns. Historical data on realized returns is often used to estimate future results. Analysts across companies use realized stock returns to estimate the risk of a stock. Consider the case of Blue Llama Mining Inc. (BLM): Five years of realized returns for BLM are given in the following table. Remember: 1. While BLM was started 40 years ago, its common stock has been publicly traded for the past 25 years. 2. The returns on its equity are calculated as arithmetic returns. 3. The historical returns for BLM for 2014 to 2018 are: 2014 2015 2016 2017 2018 Stock return 5.00% 3.40% 6.00% 8.40% 2.60% Given the preceding data, the average realized return on BLM’s stock is BLANK . The preceding data series represents BLANK of BLM’s historical returns. Based on this conclusion, the standard deviation of BLM’s historical returns is BLANK . If investors expect the…arrow_forward
- 1).Big Rock is listed on the local stock exchange and its stock has had mixed performanceover the last few months. The company’s directors are interested in seeing how BigRock’s performance compares to other companies in the sector. Company Initial Investment Value End of Year 1 Value Endof Year 2 Value Endof Year 3Big Rock Building Inc. $1,000 $1,268 $1334 $1,105 Required: Calculate the arithmetic mean and the geometric mean over the three-yearperiod for the investments made. 2).The company’s pension plan is managed by Castle Fund Managers, a leading provider ofpension services. It is a defined contribution plan, where the employees’ contributions arematched by the employer. Each employee had to choose one of the following investmentoptions for their individual plans: a. Preferred Accumulator (PA): Short-term focusb. Balanced Accumulator (BA): Medium-term focusc. Select…arrow_forwardHow is this set-up to solve? Ford Stock I) & II) were in previous question GM stock produced the following monthly returns (January - May): 5%, 8%, -2%, 12%, and 15%. Ford stock produced the following monthly returns (January - May): 1%, 10%, 6%, 3%, and 2%. I) Calculate the average return for each stock. II) Calculate the standard deviation of monthly return for each stock. III) Calculate the correlation coefficient between GM and Ford stocks.arrow_forwardInvestors expect a company to announce a 9 percent decrease in earnings, but instead the company announces a 1 percent decrease. If the market is semistrong-form efficient, which of the following should happen? a. The stock’s price rises because the earnings decrease was less than expected. b. The stock’s price stays the same because earnings announcements have no effect if the market is semistrong-form efficient. c. The stock’s price decreases slightly because the company had a slight decrease in earnings.arrow_forward
- Returns earned over a given time period are called realized returns. Historical data on realized returns is often used to estimate future results. Analysts across companies use realized stock returns to estimate the risk of a stock. Consider the case of Falcon Freight Inc. (FF): Five years of realized returns for FF are given in the following table. Remember: 1. While FF was started 40 years ago, its common stock has been publicly traded for the past 25 years. 2. The returns on its equity are calculated as arithmetic returns. 3. The historical returns for FF for 2014 to 2018 are: 2014 2015 2016 2017 2018 Stock return 25.00% 17.00% 30.00% 42.00% 13.00% Given the preceding data, the average realized return on FF’s stock is (63.50%, 25.40%, 50.80%, 78.74%) . The preceding data series represents (the population, a sample, the universe) of FF’s historical returns. Based on this conclusion, the standard deviation of FF’s historical…arrow_forwardCalculating the geometric and arithmetic average rate of return) Marsh Inc. had the following end-of-year stock prices over the last five years and paid no cash dividends: Time Marsh 1 $11 2 11 3 18 4 9 5 11 (Click on the icon in order to copy its contents into a spreadsheet.) a. Calculate the annual rate of return for each year from the above information. b. What is the arithmetic average rate of return earned by investing in Marsh's stock over this period? c. What is the geometric average rate of return earned by investing in Marsh's stock over this period? d. Considering the beginning and ending stock prices for the five-year period are the same, which type of average rate of return (the arithmetic or geometric) better describes the average annual rate of return earned over the period? Question content area bottom Part 1 a. The annual rate of return at the end of year 2 is enter your…arrow_forwardYou’ve observed the following returns on Yasmin Corporation’s stock over the past five years: 15 percent, –6 percent, 18 percent, 14 percent, and 10 percent. a. What was the arithmetic average return on the company's stock over this five-year period? (Do not round intermediate calculations. Enter your answer as a percent rounded to 1 decimal place, e.g., 32.1.) Average return % b-1 What was the variance of the company's stock returns over this period? (Do not round intermediate calculations and round your answer to 5 decimal places, e.g., 32.16161.) Variance b-2 What was the standard deviation of the company's stock returns over this period? (Do not round intermediate calculations. Enter your answer as a percent rounded to 2 decimal places, e.g., 32.16.) Standard deviation %arrow_forward
- The returns on the common stock of New Image Products are quite cyclical. In a boom economy, the stock is expected to return 23 percent in comparison to 14 percent in a normal economy and a negative 18 percent in a recessionary period. The probability of a recession is 18 percent while the probability of a boom is 22 percent. What is the standard deviation of the returns on this stock? P/s : Please show the step by step not using calculation via excel sheet. Thank you.arrow_forwardcould someone please explain to me why the decrease in stock price ( from 20th April) for the west texas intermediate is unusual? and explain why this has occurred and why the recovery is so sharp. Thanksarrow_forwardThe common stock of Air United, Inc., had annual returns of 15.6 percent, 2.4 percent, -11.8 percent, and 32.9 percent over the last four years, respectively. What is the standard deviation of these returns? Group of answer choices 13.29 percent 14.14 percent 16.50 percent 17.78 percent 19.05 percent show your work please and let me know if we can solve it by financial calculatorarrow_forward
arrow_back_ios
SEE MORE QUESTIONS
arrow_forward_ios
Recommended textbooks for you
 EBK CONTEMPORARY FINANCIAL MANAGEMENTFinanceISBN:9781337514835Author:MOYERPublisher:CENGAGE LEARNING - CONSIGNMENT
 Financial Reporting, Financial Statement Analysis...FinanceISBN:9781285190907Author:James M. Wahlen, Stephen P. Baginski, Mark BradshawPublisher:Cengage Learning
 Auditing: A Risk Based-Approach to Conducting a Q...AccountingISBN:9781305080577Author:Karla M Johnstone, Audrey A. Gramling, Larry E. RittenbergPublisher:South-Western College Pub
 Essentials Of Business AnalyticsStatisticsISBN:9781285187273Author:Camm, Jeff.Publisher:Cengage Learning,
EBK CONTEMPORARY FINANCIAL MANAGEMENT
Finance
ISBN:9781337514835
Author:MOYER
Publisher:CENGAGE LEARNING - CONSIGNMENT
Financial Reporting, Financial Statement Analysis...
Finance
ISBN:9781285190907
Author:James M. Wahlen, Stephen P. Baginski, Mark Bradshaw
Publisher:Cengage Learning
Auditing: A Risk Based-Approach to Conducting a Q...
Accounting
ISBN:9781305080577
Author:Karla M Johnstone, Audrey A. Gramling, Larry E. Rittenberg
Publisher:South-Western College Pub
Essentials Of Business Analytics
Statistics
ISBN:9781285187273
Author:Camm, Jeff.
Publisher:Cengage Learning,
8 Common Investor Biases (And How to Overcome Them); Author: Next Level Life;https://www.youtube.com/watch?v=7btv02RgCzo;License: Standard Youtube License