
CORPORATE FIN.(LL)-W/ACCESS >CUSTOM<
11th Edition
ISBN: 9781260269901
Author: Ross
Publisher: MCG CUSTOM
expand_more
expand_more
format_list_bulleted
Concept explainers
Videos
Textbook Question
Chapter 14, Problem 3QP
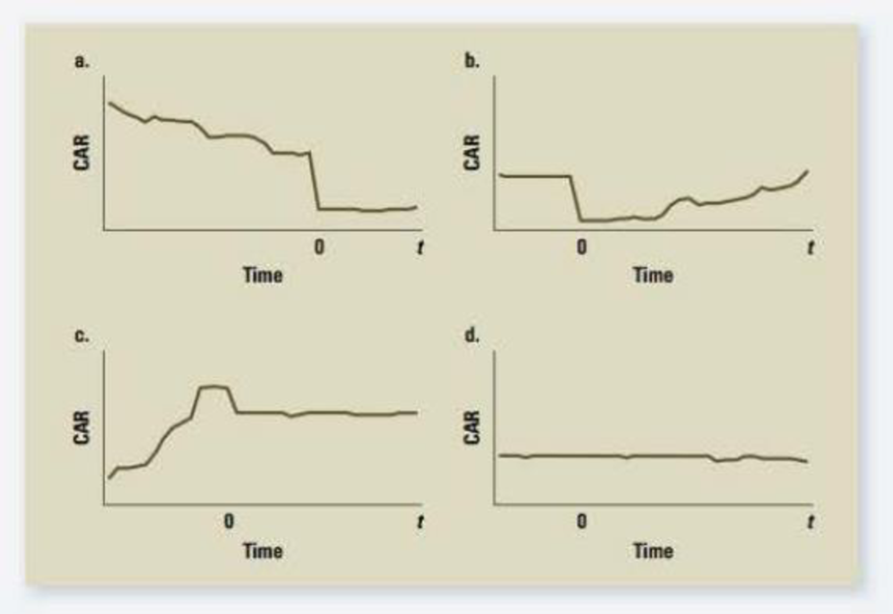
Cumulative Abnormal Returns The following figures present the results of four cumulative abnormal returns (CAR) studies. Indicate whether the results of each study support, reject, or arc inconclusive about the semistrong form of the
Expert Solution & Answer
Want to see the full answer?
Check out a sample textbook solution
Students have asked these similar questions
Which of the following statements is INCORRECT about the Random Walk Hypothesis? A) It assumes successive returns are statistically independent. B) It assumes there is no correlation between the returns in one period and the next. C) It assumes the distribution of returns in all periods is identical. D) It assumes historical share prices can be used to predict future price movements.
Evidence of market inefficiency occurs when investors earn abnormal returns:
Only in the short term.
In any given quarter.
In any given year.
Consistently over the long term.
All of the above answers are correct.
None of the above answers is correct.
The finding that trading on analysts stock recommendations generates an abnormal return (alpha) is:Group of answer choices
a) a violation of weak form market efficiency.
b) a violation of semi-strong form market efficiency.
c) consistent with CAPM.
d) consistent with market efficiency.
Chapter 14 Solutions
CORPORATE FIN.(LL)-W/ACCESS >CUSTOM<
Ch. 14 - Prob. 1CQCh. 14 - Prob. 2CQCh. 14 - Efficient Market Hypothesis Which of the following...Ch. 14 - Market Efficiency Implications Explain why a...Ch. 14 - Efficient Market Hypothesis A stock market analyst...Ch. 14 - Semistrong Efficiency If a market is semistrong...Ch. 14 - Efficient Market Hypothesis What are the...Ch. 14 - Prob. 8CQCh. 14 - Prob. 9CQCh. 14 - Efficient Market Hypothesis For each of the...
Ch. 14 - Technical Analysis What would a technical analyst...Ch. 14 - Prob. 12CQCh. 14 - Prob. 13CQCh. 14 - Efficient Markets A hundred years ago or so,...Ch. 14 - Efficient Market Hypothesis Aerotech, an aerospace...Ch. 14 - Prob. 16CQCh. 14 - Prob. 17CQCh. 14 - Efficient Market Hypothesis Newtech Corp. is going...Ch. 14 - Prob. 19CQCh. 14 - Efficient Market Hypothesis The Durkin Investing...Ch. 14 - Efficient Market Hypothesis Your broker commented...Ch. 14 - Efficient Market Hypothesis A famous economist...Ch. 14 - Efficient Market Hypothesis Suppose the market is...Ch. 14 - Prob. 24CQCh. 14 - Prob. 25CQCh. 14 - Efficient Market Hypothesis Assume that markets...Ch. 14 - Prob. 27CQCh. 14 - Evidence on Market Efficiency Some people argue...Ch. 14 - Prob. 1QPCh. 14 - Cumulative Abnormal Returns The following diagram...Ch. 14 - Cumulative Abnormal Returns The following figures...Ch. 14 - Prob. 4QPCh. 14 - Prob. 1MCCh. 14 - Prob. 2MCCh. 14 - Prob. 3MC
Knowledge Booster


Learn more about
Need a deep-dive on the concept behind this application? Look no further. Learn more about this topic, finance and related others by exploring similar questions and additional content below.Similar questions
- What are market anomalies, and how do they come about? Do they support or refute the EMH? Briefly describe each of the following: (a)The January effect (b)The size effectarrow_forwardWhich of the following statements is false? A. Historical VaR simulation involves using past data as a guide to what will happen in the future. B. Illiquidity is observed when there is a large difference between the offered sale price and the bid price. C. Yield spared is reflected in the size of the bid-ask spreads. D. The stressed VaR is based on how market variables have moved during a particularly adverse time period.arrow_forwardConsider the two (excess return) index model regression results for A and B. RA= 0.9% + 1.1RM , R-square = 0.590, and Residual Standard Deviation = 11% RB= -1.4% + 0.6RM, R-square = 0.456, and Residual Standard Deviation = 9.2% Which stock has more firm-specific risk, market risk, and greater fraction of return variability for market movement? Also, if rf were constant at 4.4% and the regression had been run using total rather than excess returns, what would have been the regression intercept for stock A (write as percentage, rounded to 2 decimal places)?arrow_forward
- The efficient markets hypothesis identifies three forms of market efficiency. (a) You observed that high-level managers make superior returns on investments in their company’s stock. Would this be a violation of weak-form market efficiency? Would it be a violation of strong-form market efficiency? (b) If the weak form of the efficient market hypothesis is valid, must the strong form also hold? Conversely, does strong form efficiency imply weak form efficiency? (c) Stock XYZ, which traded for several months at a price of K72, and then declines to K65. if the stock eventually begins to increase in price, K72 is considered a resistance level because investors who bought originally at K72 will be eager to sell their shares as soon as they can break even on their investment. If everyone in the market believes in resistance levels, why do these beliefs not become self-fulfilling prophecies?arrow_forwardPlease answer both QUESTION 5 Which of the following is not a reason why beta may differ between sources: Beta is based on historical values. Beta may be calculated using dfferent periodicities, such as monthly, weekly, or daily. The market benchmark may differ. Beta may be calculated using 3 years of data instead of 5 years of data. QUESTION 6 According to the CAPM, which of the following risks is irrelevant? O A. Market risk • B. All risks are always relevant 0 C. Unsystematic risk • D. Systematic riskarrow_forwardWhich of the following empirical observations appear to contradict weak form market efficiency? a. The average rate of return of stocks is significantly greater than zero b. The month-to-month time series autocorrelation of stock returns is not significantly different from zero c. A strategy of buying recent high-return stocks (winners) and shorting recent low-return stocks (losers) provides significant positive alpha d. Low dividend stocks provide higher-than-average capital gains e. None of the abovearrow_forward
- Consider the following information about the various states of economy and the returns of various investment alternatives for each scenario. Answer the questions that follow. Work out the Covariance with mp showing detatiled working and explanation % Return on T-Bills, Stocks and Market Index States of Economy Probability T-Bills Phillips Pay-up Rubber-Made Market Index Recession 0.2 7 -22 28 10 -13 Below Average 0.1 7 -2 14.7 -10 1 Average 0.3 7 20 0 7 15 Above Average 0.3 7 35 -10 45 29 Boom 0.1 7 50 -20 30 43 Mean 7 16.9 20.7 19.6 15 Variance (%) ^2 0 549.09 244.124 358.04 313.6 Standard Deviation 0 23.4326695 15.6244712 18.92194493 17.7087549 Coefficient of Variation 0 1.386548491 7.54805372 0.965405354 1.18058366 Covariance wit MP Correlation with Market Index…arrow_forwardYou are given the following information: State ofEconomy Return onStock A Return onStock B Bear .112 −.055 Normal .105 .158 Bull .083 .243 Assume each state of the economy is equally likely to happen. a. Calculate the expected return of each stock. (Do not round intermediate calculations and enter your answers as a percent rounded to 2 decimal places, e.g., 32.16.) b. Calculate the standard deviation of each stock. (Do not round intermediate calculations and enter your answers as a percent rounded to 2 decimal places, e.g., 32.16.) c. What is the covariance between the returns of the two stocks? (A negative answer should be indicated by a minus sign, Do not round intermediate calculations and round your answer to 6 decimal places, e.g., .161616.) d. What is the correlation between the returns of the two stocks? (A negative answer should be indicated by a minus sign, Do not round intermediate calculations and round your answer to 4…arrow_forwardA support level is the price range at which a technical analyst would expect the A) supply of a stock to increase dramatically. B) supply of a stock to decrease substantially. C) demand for a stock to increase substantially. D) demand for a stock to decrease substantially. E) price of a stock to fall. 8) A market decline of 23% on a day when there is no significant macroeconomic event ______ consistent with the EMH because ________. Please provide an accurate justification for the chosen answer.arrow_forward
- Suppose that, after conducting an analysis of past stock prices, you come up with the following observations. Which would appear to contradict the weak form of the efficient market hypothesis? A. The average rate of return is significantly greater than zero. B. The correlation between the return during a given week and the return during the following week is zero. C. One could have made superior returns by buying stock after a 10% rise in price and selling after a 10% fall. D. One could have made higher-than-average capital gains by holding stocks with low dividend yields.arrow_forwardWhich of the following statements is false? A. The lower the correlation coefficient, the greater the potential benefits from diversification. B. To make the covariance of two random variables easier to interpret, it may be divided by the product of the random variables’ standard deviation. The resulting value is called the correlation coefficient, or simply, correlation. C. The risk that remains cannot be diversified away and is called the systematic risk. D. In the event of bankruptcy, preferred stock ranks below common stock but above debt.arrow_forwardWhich of the following statements is most correct? Why?* a. If a market is weak-form efficient, this means that prices rapidly reflect all available public information. b. If a market is weak-form efficient, this means that you can expect to beat the market by using technical analysis that relies on the charting of past prices. c. If a market is strong-form efficient, this means that all stocks should have the same expected return. d. All of the statements above are correct. c. None of the statements above is correct.arrow_forward
arrow_back_ios
SEE MORE QUESTIONS
arrow_forward_ios
Recommended textbooks for you
 Essentials of Business Analytics (MindTap Course ...StatisticsISBN:9781305627734Author:Jeffrey D. Camm, James J. Cochran, Michael J. Fry, Jeffrey W. Ohlmann, David R. AndersonPublisher:Cengage Learning
 Financial Reporting, Financial Statement Analysis...FinanceISBN:9781285190907Author:James M. Wahlen, Stephen P. Baginski, Mark BradshawPublisher:Cengage Learning
Essentials of Business Analytics (MindTap Course ...
Statistics
ISBN:9781305627734
Author:Jeffrey D. Camm, James J. Cochran, Michael J. Fry, Jeffrey W. Ohlmann, David R. Anderson
Publisher:Cengage Learning
Financial Reporting, Financial Statement Analysis...
Finance
ISBN:9781285190907
Author:James M. Wahlen, Stephen P. Baginski, Mark Bradshaw
Publisher:Cengage Learning
Portfolio return, variance, standard deviation; Author: MyFinanceTeacher;https://www.youtube.com/watch?v=RWT0kx36vZE;License: Standard YouTube License, CC-BY