
Loose-leaf For Applied Statistics In Business And Economics
5th Edition
ISBN: 9781259328527
Author: David Doane, Lori Seward Senior Instructor of Operations Management
Publisher: McGraw-Hill Education
expand_more
expand_more
format_list_bulleted
Concept explainers
Videos
Textbook Question
Chapter 14, Problem 31CE
(a) Plot the data on revolving credit (credit cards and home equity lines of credit are the two major types of revolving credit). (b) Use MegaStat or Minitab to calculate seasonal indexes and trend. Is there a trend? (c) Which months have the most borrowing? The least? Is this logical? (d) Discuss anything unusual in the shape of the trend that might make forecasting difficult.
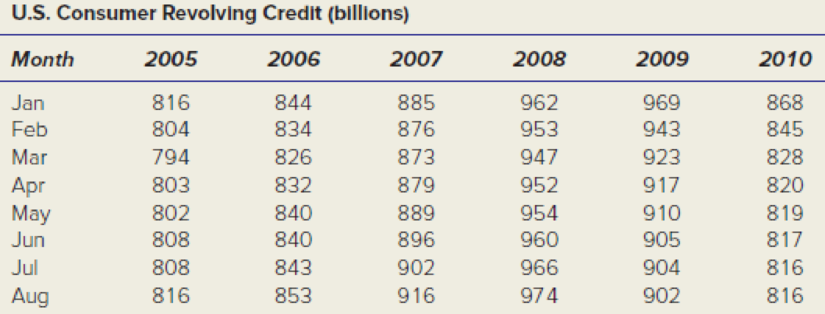
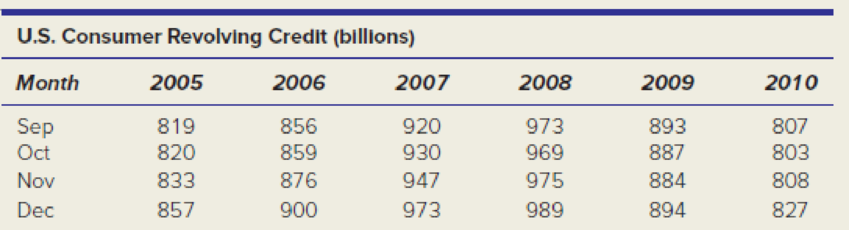
Source: www.federalreserve.gov.
Expert Solution & Answer
Want to see the full answer?
Check out a sample textbook solution
Students have asked these similar questions
Use the accompanying data table regarding retirement funds. Complete parts (a) through (d) below.
a. Construct a growth and value table that tabulates type, market cap, risk,and rating.
What is the most effective method for predicting future stock prices based on historical data, and how accurate are these predictions compared to other forecasting models?
What do the Forecast for each year add up to?
Chapter 14 Solutions
Loose-leaf For Applied Statistics In Business And Economics
Ch. 14.2 - Prob. 2SECh. 14.2 - Prob. 3SECh. 14.2 - Prob. 4SECh. 14.2 - Prob. 5SECh. 14.4 - (a) Make an Excel line graph of the exchange rate...Ch. 14.5 - Prob. 7SECh. 14 - Explain the difference between (a) stocks and...Ch. 14 - (a) What is periodicity? (b) Give original...Ch. 14 - (a) What are the distinguishing features of each...Ch. 14 - Name four criteria for assessing a trend forecast.
Ch. 14 - Name two advantages and two disadvantages of each...Ch. 14 - When would the exponential trend model be...Ch. 14 - Explain how to obtain the compound percent growth...Ch. 14 - (a) When might a quadratic model be useful? (b)...Ch. 14 - Name five measures of fit for a trend, and state...Ch. 14 - Prob. 10CRCh. 14 - Prob. 11CRCh. 14 - Prob. 12CRCh. 14 - (a) Why is seasonality irrelevant for annual data?...Ch. 14 - Prob. 14CRCh. 14 - (a) Explain how seasonal binaries can be used to...Ch. 14 - What is the purpose of index numbers?Ch. 14 - Prob. 10CECh. 14 - Prob. 11CECh. 14 - Prob. 12CECh. 14 - Prob. 14CECh. 14 - Prob. 15CECh. 14 - Prob. 16CECh. 14 - Prob. 17CECh. 14 - Prob. 18CECh. 14 - Prob. 19CECh. 14 - Prob. 20CECh. 14 - Prob. 21CECh. 14 - Prob. 22CECh. 14 - (a) Plot the data on skier/snowboard visits. (b)...Ch. 14 - Prob. 25CECh. 14 - (a) Use Excel, MegaStat, or MINITAB to fit an...Ch. 14 - Prob. 27CECh. 14 - Prob. 28CECh. 14 - Prob. 29CECh. 14 - Prob. 30CECh. 14 - (a) Plot the data on revolving credit (credit...
Knowledge Booster


Learn more about
Need a deep-dive on the concept behind this application? Look no further. Learn more about this topic, statistics and related others by exploring similar questions and additional content below.Similar questions
- discuss the trend analysis of the oil palm pricingarrow_forwardCanton Supplies, Inc., is a service firm that employs approximately 100 people. Because of the necessity of meeting monthly cash obligations, the chief financial officer wants to develop a forecast of monthly cash requirements. Because of a recent change in equipment and operating policy, only the past seven months of data are considered relevant. The change in operations has had a great impact on cash flow. What forecasting model do you recommend?arrow_forwardCryptocurrencies have rapidly become an important alternative to traditional currencies for many types of transactions. Etherium, one of the most prominent cryptocurrencies, has rapidly appreciated in value. Daily Etherium trading information for the first 332 days of 2021. It includes the following variables: Date Day – Day of the year, used to assess trend over time Volume (US $) – Daily trading volume Opening Price (US $) – Opening price for daily trading Price Change (US $) – Daily change in price from opening to close 1. Determine the sample correlation coefficient, r, between Volume and Price Change. Test the alternative hypothesis that Volume has a linear relationship to Price Change. Specifically, what are the test statistic and the p-value for that test statistic? For α = .05, what do you conclude about the relationship between the variables? (reminder: the T.DIST.2T function requires input of a positive test statistic)arrow_forward
- At the end of 2015, the US Bureau of Economics Analysis posted the following data on the U.S disposable personal income by month for the 11 months of the year as indicated in this tablearrow_forward2021 2020 2019 2018 2017 Sales $ 497,289 $ 327, 164 $ 267,073 $ 197, 102 $ 141,800 Cost of goods sold 251,145 165, 182 137, 037 99,651 70,900 Accounts receivable 23,969 19, 172 18,214 11,511 9,699 Compute trend percents for the above accounts, using 2017 as the base year.arrow_forwardUse the dataset to complete the EXACT five-number summary of the dollar values of the LEXCX mutual fund. Do not round your results even if they go beyond two decimal places. For any calculated values, show your work in the table along with your answer.arrow_forward
arrow_back_ios
SEE MORE QUESTIONS
arrow_forward_ios
Recommended textbooks for you
 MATLAB: An Introduction with ApplicationsStatisticsISBN:9781119256830Author:Amos GilatPublisher:John Wiley & Sons Inc
 Probability and Statistics for Engineering and th...StatisticsISBN:9781305251809Author:Jay L. DevorePublisher:Cengage Learning
 Statistics for The Behavioral Sciences (MindTap C...StatisticsISBN:9781305504912Author:Frederick J Gravetter, Larry B. WallnauPublisher:Cengage Learning
 Elementary Statistics: Picturing the World (7th E...StatisticsISBN:9780134683416Author:Ron Larson, Betsy FarberPublisher:PEARSON
 The Basic Practice of StatisticsStatisticsISBN:9781319042578Author:David S. Moore, William I. Notz, Michael A. FlignerPublisher:W. H. Freeman
 Introduction to the Practice of StatisticsStatisticsISBN:9781319013387Author:David S. Moore, George P. McCabe, Bruce A. CraigPublisher:W. H. Freeman
MATLAB: An Introduction with Applications
Statistics
ISBN:9781119256830
Author:Amos Gilat
Publisher:John Wiley & Sons Inc
Probability and Statistics for Engineering and th...
Statistics
ISBN:9781305251809
Author:Jay L. Devore
Publisher:Cengage Learning
Statistics for The Behavioral Sciences (MindTap C...
Statistics
ISBN:9781305504912
Author:Frederick J Gravetter, Larry B. Wallnau
Publisher:Cengage Learning
Elementary Statistics: Picturing the World (7th E...
Statistics
ISBN:9780134683416
Author:Ron Larson, Betsy Farber
Publisher:PEARSON
The Basic Practice of Statistics
Statistics
ISBN:9781319042578
Author:David S. Moore, William I. Notz, Michael A. Fligner
Publisher:W. H. Freeman
Introduction to the Practice of Statistics
Statistics
ISBN:9781319013387
Author:David S. Moore, George P. McCabe, Bruce A. Craig
Publisher:W. H. Freeman
Which is the best chart: Selecting among 14 types of charts Part II; Author: 365 Data Science;https://www.youtube.com/watch?v=qGaIB-bRn-A;License: Standard YouTube License, CC-BY