
Concept explainers
Videos
The following is the ANOVA summary table for a multiple regression model with two independent variables:
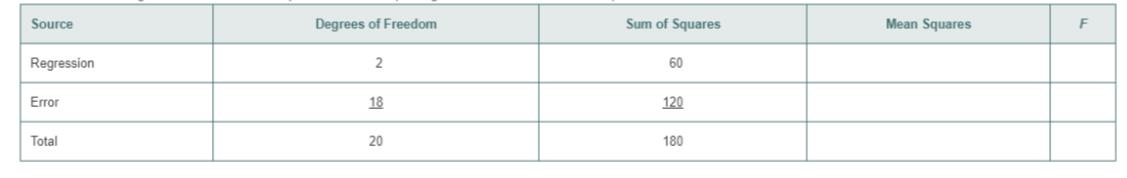
a determine whether there is a significant relationship between
b. compute the coefficients of partial determination,
Want to see the full answer?
Check out a sample textbook solution
Chapter 14 Solutions
Basic Business Statistics, Student Value Edition


- Given the partial results from a linear regression model below, a sample size of 504, and ɑ=0.05, What is the F-Statistic for the overall model? Is it statistically significant? What is the R2 for the regression model above?arrow_forwardThe following estimated regression model was developed relating yearly income (y in $1000s) of 30 individuals with their age (x1) and their gender (x2) (0 if male and 1 if female).ŷ = 30 + 0.7x1 + 3x2Also provided are SST = 1200 and SSE = 384.The yearly income of a 24-year-old female individual is _____.arrow_forwardCalculate the R2of the following multivariate sample regression functions and interpret theanswers.3.1 Investment-hat = β1-hat + β2-hat*Interest rate + β3-hat*Exchange rateESS = 900RSS = 1003.2 Investment-hat = β1 + β2-hat*Interest rate + β3-hat*number of 311 studentsESS = 400RSS = 6003.3 Salary-hat = β1 + β2-hat*Frequency of blinking eyes + β3-hat*Colour of hairRSS = 950TSS = 1000arrow_forward
- Given a generic data set (x,y) with a linear regression. How do you determine if the y(dependent) will be less/greater than a certain value at a decided value of x?arrow_forwardFor variables x1, x2, x3, and y satisfying the assumptions for multiple linear regression inferences, the population regression equation is y = 27 – 4.7x1 + 2.3x2 + 5.8x3. For samples of size 20 and given values of the predictor variables, the distribution of the estimates of ß1 for all possible sample regression planes is a _________ distribution with mean a_________ and standard deviation _______.arrow_forwardA researcher would like to predict the dependent variable YY from the two independent variables X1X1 and X2X2 for a sample of N=10N=10 subjects. Use multiple linear regression to calculate the coefficient of multiple determination and test statistics to assess the significance of the regression model and partial slopes. Use a significance level α=0.01α=0.01. X1X1 X2X2 YY 58.8 29.9 63.1 64.1 57.3 40.1 51.4 35.3 46.2 77.1 88.5 30 60.6 67.5 16.2 68.3 63.4 62 44.8 6.6 77.6 49 29.3 65.5 55.5 25.8 62.5 57.5 30.2 62 R2=R2= F=F= P-value for overall model = t1=t1= for b1b1, P-value = t2=t2= for b2b2, P-value = What is your conclusion for the overall regression model (also called the omnibus test)? The overall regression model is statistically significant at α=0.01α=0.01. The overall regression model is not statistically significant at α=0.01α=0.01. Which of the regression coefficients are statistically different from zero? neither regression coefficient is…arrow_forward
- The following are data on the average weekly profits(in $1,000) of five restaurants, their seating capacities, andthe average daily traffic (in thousands of cars) that passestheir locations: Seating Traffic Weekly netcapacity count profitx1 x2 y120 19 23.8200 8 24.2150 12 22.0180 15 26.2240 16 33.5 (a) Assuming that the regression is linear, estimate β0, β1,and β2.(b) Use the results of part (a) to predict the averageweekly net profit of a restaurant with a seating capacityof 210 at a location where the daily traffic count averages14,000 cars.arrow_forwardDetermine the equation of the regression line for the following data, and compute the residuals. x 14 8 19 12 5 y 47 34 59 43 23 Do not round the intermediate values. (Round your answers to 3 decimal places.) y^= +( )x Do not round the intermediate values. (Round your answers to 3 decimal places.) x y Residuals 14 47 8 34 19 59 12 43 5 23arrow_forwardIf a sample of 25 pairs of data yields a correlation coefficient, r, of 0.390 and the scatterplot displays a linear trend, can you use the regression equation to make predictions, assuming your x-values are within the domain of the data set? Choose your answer from the multiple choice answers below A.) Yes, because rcrit = 0.396 and the regression coefficient, r, is less than this value. B.) Yes, because rcrit = 0.381 and the regression coefficient, r, is greater than this value. C.) No, because rcrit = 0.381 and the regression coefficient, r, is greater than this value. D.) No, because rcrit = 0.396 and the regression coefficient, r, is less than this value.arrow_forward
- Given below are results from the regression analysis where the dependent variable is the number of weeks a worker is unemployed due to a layoff (Unemploy) and the independent variables are the age of the worker (Age), the number of years of education received (Edu), the number of years at the previous job (Job Yr), a dummy variable for marital status (Married: 1=married, 0=otherwise), a dummy variable for head of household (Head: 1=yes, 0=no) and a dummy variable for management position (Manager: 1=yes, 0=no). We shall call this Model 1. The coefficient of partial determination (R2Yj.(All variables except j)) of each of the six predictors are, respectively, 0.2807, 0.0386, 0.0317, 0.0141, 0.0958, and 0.1201. Model 2 is the regression analysis where the dependent variable is Unemploy and the independent variables are Age and Manager. The results of the regression analysis are given. Refer to model 1. Which of the following is the correct null hypothesis to test…arrow_forwardConsider the following correlations -0.9 , -0.5 , -0.2 , 0 , 0.2 , 0.5 and 0.9. For each give the fraction of the variation in y that is explained by the least-squares regression of y on x.arrow_forwardConsider the following population linear regression model of individual food expenditure: Y = 50 + 0.5X + u, where Y is weekly food expenditure in dollars, X is the individual’s age, and 50+0.5X is the population regression line. Suppose we generate artificial data for 3 individuals using this model. This artificial sample, which consists of 3 observations, is shown in the following table: Answer the following questions. Show your working. (a) What are the values of V1 and V4? (b) Suppose we know that in this artificial sample, the sample covariance between X and Y is 150, and the sample variance of X is 100. Compute the OLS regression line of the regression of Y on X. (Hint: Assume these summary statistics and the OLS regression line continue to hold in parts (c)-(e).) (c) What are the values of V5 and V7?arrow_forward
 Glencoe Algebra 1, Student Edition, 9780079039897...AlgebraISBN:9780079039897Author:CarterPublisher:McGraw Hill