1.
Prepare an interim quality cost performance report for the year 2015 that compares actual quality costs with budgeted quality costs and comment on the ability of the firm for achieving its quality goals for the year.
1.
Explanation of Solution
Quality cost performance reports: In a quality cost performance report, identification of quality standard is the main element and it has two important elements namely; actual outcomes and expected or standard outcomes.
Interim quality report: Interim quality performance report compares the actual quality at the end of the period with the budgeted costs and this report examines the progress attained within the period comparative to the planned level of progress for that period.
Prepare an interim quality cost performance report for the year 2015:
| Company I | ||||
| Interim Performance Report: Quality Costs | ||||
| For the Year Ended December 31, 2015 | ||||
| Particulars |
Actual Costs (a) |
Budgeted costs (b) |
Variance | |
| Prevention costs: | ||||
| Fixed: | ||||
| Quality planning | $150,000 | $150,000 | $0 | |
| Quality training | $20,000 | $20,000 | $0 | |
| Quality improvement | $100,000 | $80,000 | $20,000 | U |
| Quality reporting | $12,000 | $10,000 | $2,000 | U |
| Total prevention costs | $282,000 | 260,000 | $22,000 | U |
| Appraisal costs: | ||||
| Variable: | ||||
| Proofreading | $520,000 | $500,000 | $20,000 | U |
| Other inspection | $60,000 | $50,000 | $10,000 | U |
| Total appraisal costs | $580,000 | 550,000 | $30,000 | U |
| Failure costs: | ||||
| Variable: | ||||
| Correction of typos | $165,000 | $150,000 | $15,000 | U |
| Rework | $76,000 | $75,000 | $1,000 | U |
| Plate revisions | $58,000 | $55,000 | $3,000 | U |
| Press downtime | $102,000 | $100,000 | $2,000 | U |
| Waste | $ 136,000 | $130,000 | $ 6,000 | U |
| Total failure costs | $537,000 | $510,000 | $27,000 | U |
| Total quality costs | $1,399,000 | $1,320,000 | $79,000 | U |
Table (1)
Every single category and each individual item are equivalent to or higher than the budgeted amounts. Therefore, the firm cannot achieve its budgeted goals for the year.
2.
Prepare a one-period quality performance report for 2015 that compares the actual quality costs of 2014 with the actual costs of 2015 and state the amount of change in profit due to improvement in quality.
2.
Explanation of Solution
Prepare a one-period quality performance report for 2015:
| Company I | ||||
| Performance Report: Quality Costs | ||||
| One-Year Trend | ||||
| For the Year Ended December 31, 2015 | ||||
| Particulars |
Actual Costs 2015 (a) |
Actual Costs 2014 (b) |
Variance | |
| Prevention costs: | ||||
| Fixed: | ||||
| Quality planning | $150,000 | $140,000 | ($10,000) | U |
| Quality training | $20,000 | $20,000 | $0 | |
| Quality improvement | $100,000 | $120,000 | $20,000 | F |
| Quality reporting | $12,000 | $12,000 | $0 | |
| Total prevention costs | $282,000 | $292,000 | $10,000 | F |
| Appraisal costs: | ||||
| Variable: | ||||
| Proofreading | $520,000 | $580,000 | $60,000 | F |
| Other inspection | $60,000 | $80,000 | $20,000 | F |
| Total appraisal costs | $580,000 | $660,000 | $80,000 | F |
| Failure costs: | ||||
| Variable: | ||||
| Correction of typos | $165,000 | $200,000 | $35,000 | F |
| Rework | $76,000 | $131,000 | $55,000 | F |
| Plate revisions | $58,000 | $83,000 | $25,000 | F |
| Press downtime | $102,000 | $123,000 | $21,000 | F |
| Waste | $ 136,000 | $191,000 | $ 55,000 | F |
| Total failure costs | $537,000 | $728,000 | $191,000 | F |
| Total quality costs | $1,399,000 | $1,680,000 | $281,000 | F |
Table (2)
- The quality cost reduced from 2014 to 2015; therefore, the profit increased to $281,000. There is still considerable improvement even though the budgeted reductions for the year are not met.
- Additionally, the improvement was due to the “reduction of failure costs” which is a positive sign denoting that quality is certainly increasing.
3.
Prepare a graph that shows the trend in total quality costs as a percentage of sales since the inception of the quality improvement program.
3.
Explanation of Solution
Multiple-period quality trend reports: Multiple-period quality trend reports is a chart or graph that tracks the change in quality from the starting of the program to the present.
Prepare a graph:
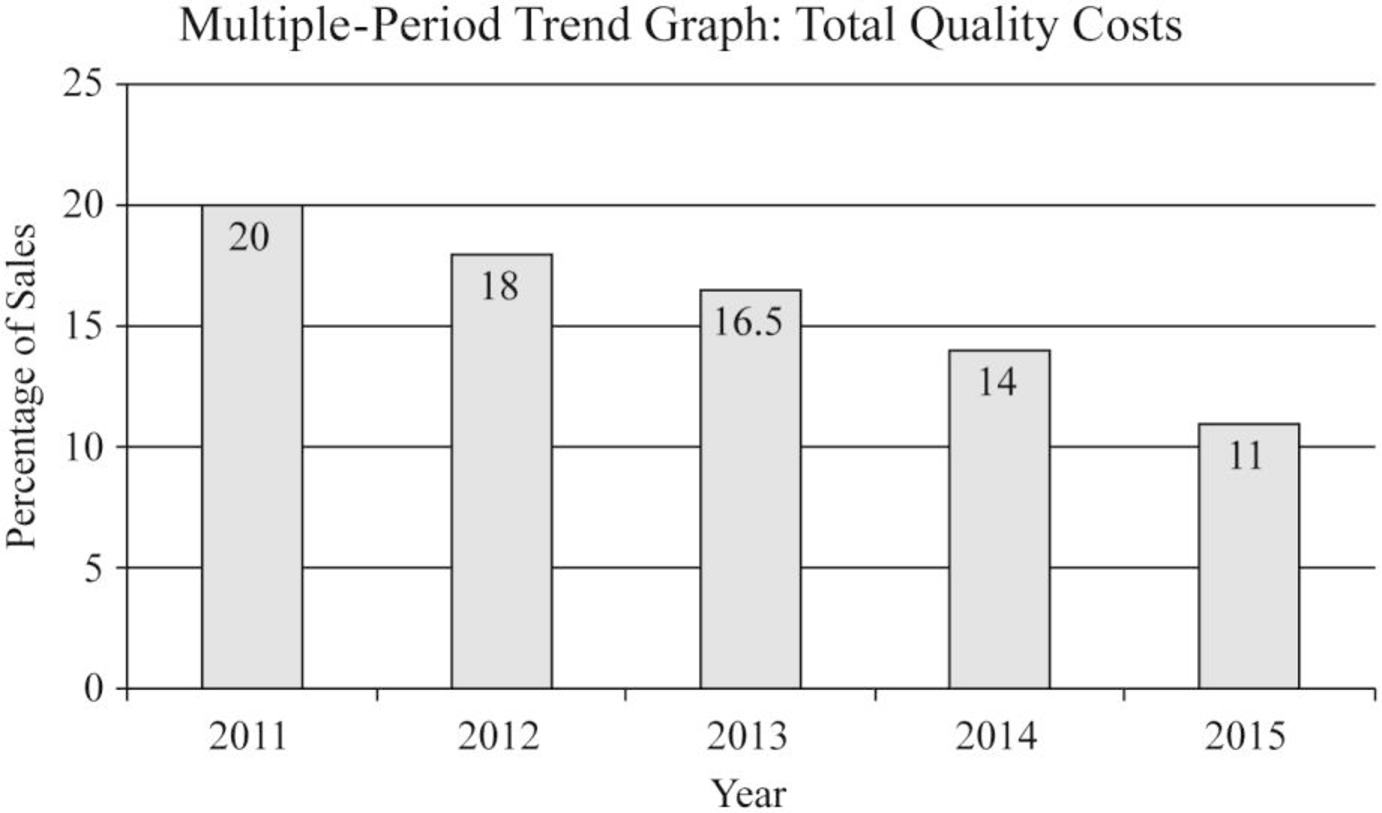
Figure (1)
Working notes:
(1)Calculate the percent of sales:
| Year |
Quality Costs (a) |
Sales Revenues (b) |
Percent of sales |
| 2011 | $2,000,000 | $10,000,000 | 20% |
| 2012 | $1,800,000 | $10,000,000 | 18% |
| 2013 | $1,815,000 | $11,000,000 | 16.5% |
| 2014 | $1,680,000 | $12,000,000 | 14% |
| 2015 | $1,320,000 | $12,000,000 | 11.65% |
Table (3)
4.
Prepare a graph that shows the trend for all four quality cost categories for 2011 through 2015 and state the manner in which the graphs helps management to know that the reduction in total quality costs is attributable to quality improvement.
4.
Explanation of Solution
Prepare a graph:
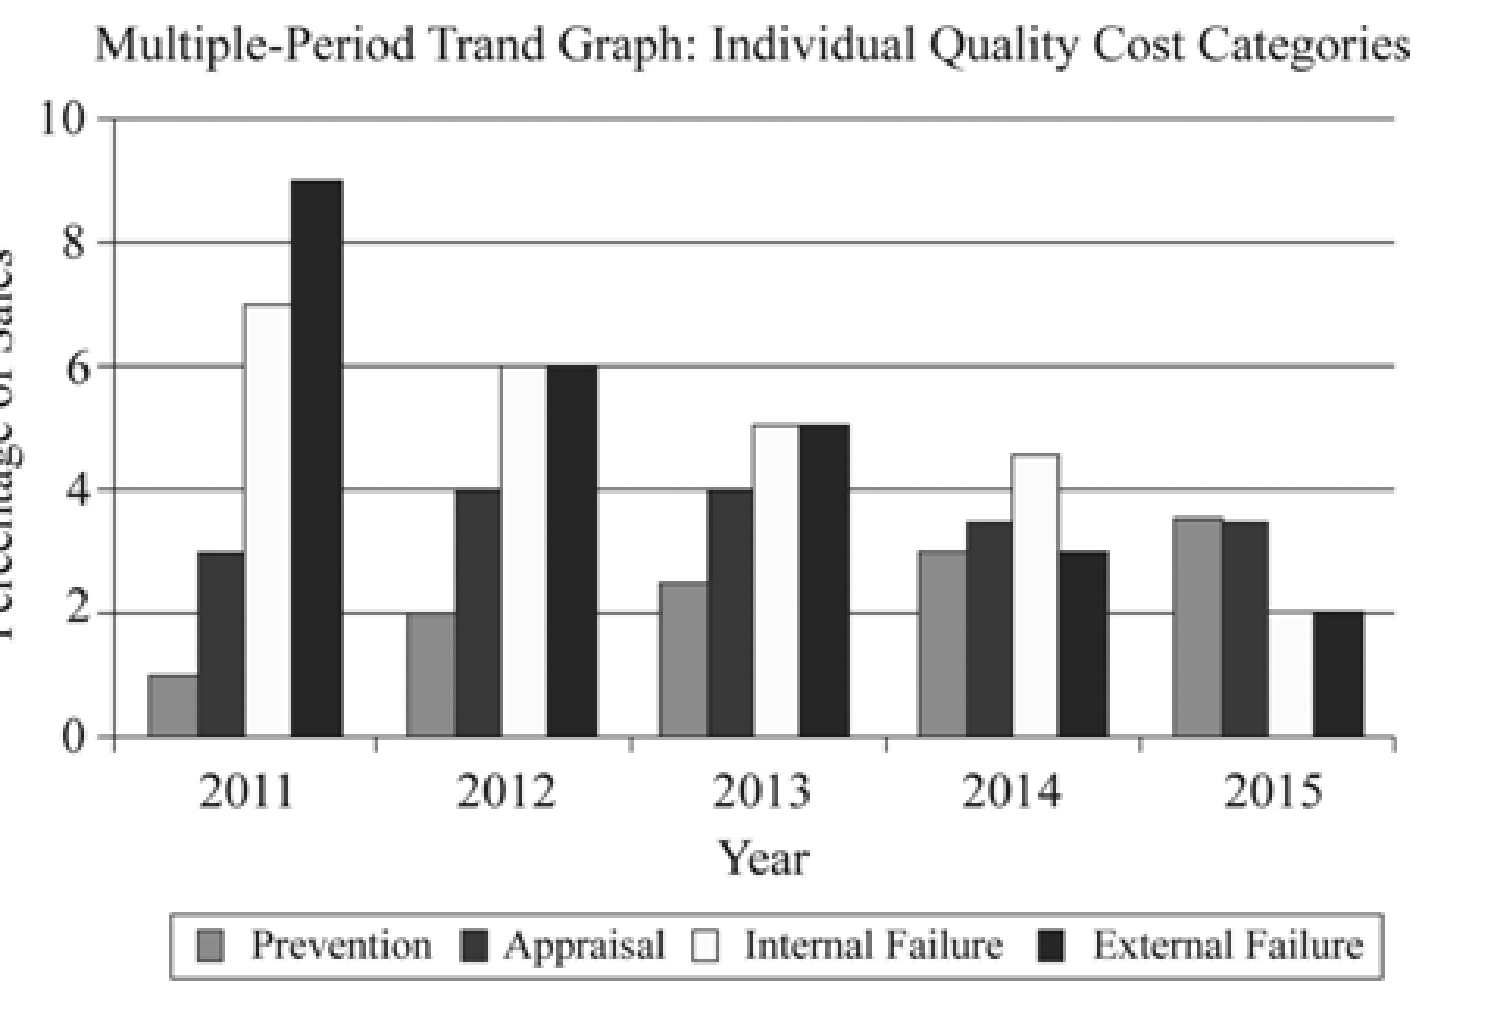
Figure (2)
“Increases in prevention and appraisal costs” along with simultaneous decrease in failure costs are good indication that in general quality is increasing. It is to be noted, that decreases in external failure costs are mostly difficult to attain without increase in actual quality.
5.
Prepare a long-range quality cost performance report.
5.
Explanation of Solution
Long-range performance report: Long-range performance report compares the “current actual” with the costs that will be allowed if the “zero-defects standard” is being met by assuming that sales level is equal to that of the existing period.
Prepare a long-range quality cost performance report:
| Company I | ||||
| Performance Report: Quality Costs | ||||
| One-Year Trend | ||||
| For the Year Ended December 31, 2015 | ||||
| Particulars |
Actual Costs 2015 (a) |
Long-Range Target Costs (b) |
Variance | |
| Prevention costs: | ||||
| Fixed: | ||||
| Quality planning | $150,000 | $0 | $150,000 | U |
| Quality training | $20,000 | (9)$112,500 | ($92,500) | F |
| Quality improvement | $100,000 | $0 | $100,000 | U |
| Quality reporting | $12,000 | (10)$26,250 | ( $14,250) | F |
| Total prevention costs | $282,000 | $138,750 | $143,250 | U |
| Appraisal costs: | ||||
| Variable: | ||||
| Proofreading | (2)$650,000 | (11)$187,500 | $462,500 | U |
| Other inspection | (3) $75,000 | (12)$48,750 | $26,250 | U |
| Total appraisal costs | $725,000 | $236,250 | $488,750 | U |
| Failure costs: | ||||
| Variable: | ||||
| Correction of typos | (4)$206,250 | $0 | $206,250 | U |
| Rework | (5)$95,000 | $0 | $95,000 | U |
| Plate revisions | (6)$72,500 | $0 | $72,500 | U |
| Press downtime | (7)$127,500 | $0 | $127,500 | U |
| Waste | (8) $170,000 | $0 | $170,000 | U |
| Total failure costs | $671,250 | $0 | $671,250 | U |
| Total quality costs | $1,678,250 | $375,000 | $1,303,250 | U |
Table (4)
Note: Apart from for prevention costs, which is a fixed cost, actual costs of 2015, are adjusted to a sales level of $15 million.
Workings notes:
(2)Calculate the proofreading costs:
(3)Calculate the other inspection costs:
(4)Calculate the correction of typos costs:
(5)Calculate the rework costs:
(6)Calculate the plate revision costs:
(7)Calculate the press downtime costs:
(8)Calculate the cost of waste:
(9)Calculate the long-range target costs for quality training:
(10)Calculate the long-range target costs for quality reporting:
(11)Calculate the long-range target costs for proofreading:
(12)Calculate the long-range target costs for other inspection:
(13)Calculate the amount of total quality costs:
Want to see more full solutions like this?
Chapter 14 Solutions
Cornerstones Of Cost Management

- Shalimar Company manufactures and sells industrial products. For next year, Shalimar has budgeted the follow sales: In Shalimars experience, 10 percent of sales are paid in cash. Of the sales on account, 65 percent are collected in the quarter of sale, 25 percent are collected in the quarter following the sale, and 7 percent are collected in the second quarter after the sale. The remaining 3 percent are never collected. Total sales for the third quarter of the current year are 4,900,000 and for the fourth quarter of the current year are 6,850,000. Required: 1. Calculate cash sales and credit sales expected in the last two quarters of the current year, and in each quarter of next year. 2. Construct a cash receipts budget for Shalimar Company for each quarter of the next year, showing the cash sales and the cash collections from credit sales. 3. What if the recession led Shalimars top management to assume that in the next year 10 percent of credit sales would never be collected? The expected payment percentages in the quarter of sale and the quarter after sale are assumed to be the same. How would that affect cash received in each quarter? Construct a revised cash budget using the new assumption.arrow_forwardCassara, Inc., had the following quality costs for the years ended December 31, 20X1 and 20X2: At the end of 20X1, management decided to increase its investment in control costs by 40% for each categorys items, with the expectation that failure costs would decrease by 25% for each item of the failure categories. Sales were 12,000,000 for both 20X1 and 20X2. Required: 1. Calculate the budgeted costs for 20X2, and prepare an interim quality performance report. 2. Comment on the significance of the report. How much progress has Cassara made?arrow_forwardJavier Company has sales of 8 million and quality costs of 1,600,000. The company is embarking on a major quality improvement program. During the next three years, Javier intends to attack failure costs by increasing its appraisal and prevention costs. The right prevention activities will be selected, and appraisal costs will be reduced according to the results achieved. For the coming year, management is considering six specific activities: quality training, process control, product inspection, supplier evaluation, prototype testing, and redesign of two major products. To encourage managers to focus on reducing non-value-added quality costs and select the right activities, a bonus pool is established relating to reduction of quality costs. The bonus pool is equal to 10 percent of the total reduction in quality costs. Current quality costs and the costs of these six activities are given in the following table. Each activity is added sequentially so that its effect on the cost categories can be assessed. For example, after quality training is added, the control costs increase to 320,000, and the failure costs drop to 1,040,000. Even though the activities are presented sequentially, they are totally independent of each other. Thus, only beneficial activities need be selected. Required: 1. Identify the control activities that should be implemented, and calculate the total quality costs associated with this selection. Assume that an activity is selected only if it increases the bonus pool. 2. Given the activities selected in Requirement 1, calculate the following: a. The reduction in total quality costs b. The percentage distribution for control and failure costs c. The amount for this years bonus pool 3. Suppose that a quality engineer complained about the gainsharing incentive system. Basically, he argued that the bonus should be based only on reductions of failure and appraisal costs. In this way, investment in prevention activities would be encouraged, and eventually, failure and appraisal costs would be eliminated. After eliminating the non-value-added costs, focus could then be placed on the level of prevention costs. If this approach were adopted, what activities would be selected? Do you agree or disagree with this approach? Explain.arrow_forward
- Andresen Company had the following quality costs for the years ended June 30, 20X1 and 20X2: At the end of 20X1, management decided to increase its investment in control costs by 50% for each categorys items, with the expectation that failure costs would decrease by 20% for each item of the failure categories. Sales were 6,000,000 for both 20X1 and 20X2. Required: 1. Calculate the budgeted costs for 20X2, and prepare an interim quality performance report. 2. Comment on the significance of the report. How much progress has Andresen made?arrow_forwardCarmichael Corporation is in the process of preparing next years budget. The pro forma income statement for the current year is as follows: Required: 1. What is the break-even sales revenue (rounded to the nearest dollar) for Carmichael Corporation for the current year? 2. For the coming year, the management of Carmichael Corporation anticipates an 8 percent increase in variable costs and a 60,000 increase in fixed expenses. What is the break-even point in dollars for next year? (CMA adapted)arrow_forwardBefore the year began, the following static budget was developed for the estimated sales of 50,000. Sales are higher than expected and management needs to revise its budget. Prepare a flexible budget for 100,000 and 110,000 units of sales.arrow_forward
- Norton Company, a manufacturer of infant furniture and carriages, is in the initial stages of preparing the annual budget for the coming year. Scott Ford has recently joined Nortons accounting staff and is interested in learning as much as possible about the companys budgeting process. During a recent lunch with Marge Atkins, sales manager, and Pete Granger, production manager, Ford initiated the following conversation. FORD: Since Im new around here and am going to be involved with the preparation of the annual budget, Id be interested in learning how the two of you estimate sales and production numbers. ATKINS: We start out very methodically by looking at recent history, discussing what we know about current accounts, potential customers, and the general state of consumer spending. Then, we add that usual dose of intuition to come up with the best forecast we can. GRANGER: I usually take the sales projections as the basis for my projections. Of course, we have to make an estimate of what this years closing inventories will be, which is sometimes difficult. FORD: Why does that present a problem? There must have been an estimate of closing inventories in the budget for the current year. GRANGER: Those numbers arent always reliable since Marge makes some adjustments to the sales numbers before passing them on to me. FORD: What kind of adjustments? ATKINS: Well, we dont want to fall short of the sales projections so we generally give ourselves a little breathing room by lowering the initial sales projection anywhere from 5 to 10 percent. GRANGER: So, you can see why this years budget is not a very reliable starting point. We always have to adjust the projected production rates as the year progresses, and of course, this changes the ending inventory estimates. By the way, we make similar adjustments to expenses by adding at least 10 percent to the estimates; I think everyone around here does the same thing. Required: 1. Marge Atkins and Pete Granger have described the use of budgetary slack. a. Explain why Atkins and Granger behave in this manner, and describe the benefits they expect to realize from the use of budgetary slack. b. Explain how the use of budgetary slack can adversely affect Atkins and Granger. 2. As a management accountant, Scott Ford believes that the behavior described by Marge Atkins and Pete Granger may be unethical and that he may have an obligation not to support this behavior. By citing the specific standards of competence, confidentiality, integrity, and/or credibility from the Statement of Ethical Professional Practice (in Chapter 1), explain why the use of budgetary slack may be unethical. (CMA adapted)arrow_forwardNabors Company had actual quality costs for the year ended June 30, 20x5, as given below. At the zero-defect state, Nabors expects to spend 375,000 on quality engineering, 75,000 on vendor certification, and 50,000 on packaging inspection. Assume sales to be 25,000,000. Required: 1. Prepare a long-range performance report for 20x5. What does this report tell the management of Nabors? 2. Explain why quality costs still are present for the zero-defect state. 3. What if Nabors achieves the zero-defect state reflected in the report? What are some of the implications of this achievement?arrow_forwardIn 20x4, Tru-Delite Frozen Desserts, Inc., instituted a quality improvement program. At the end of 20x5, the management of the corporation requested a report to show the amount saved by the measures taken during the year. The actual sales and quality costs for 20x4 and 20x5 are as follows: Tru-Delites management believes that quality costs can be reduced to 2.5 percent of sales within the next five years. At the end of 20x9, Tru-Delites sales are projected to grow to 750,000. The projected relative distribution of quality costs at the end of 20x9 is as follows: Required: 1. Profits increased by what amount due to quality improvements made in 20x5? 2. Prepare a long-range performance report that compares the quality costs incurred at the end of 20x5 with the quality cost structure expected at the end of 20x9. 3. Are the targeted costs in the year 20x9 all value-added costs? How would you interpret the variances if the targeted costs are value-added costs? 4. What would be the profit increase in 20x9 if the 2.5 percent performance standard is met in that year?arrow_forward
- The Sea Wharf Restaurant would like to determine the best way to allocate a monthly advertising budget of 1,000 between newspaper advertising and radio advertising. Management decided that at least 25% of the budget must be spent on each type of media and that the amount of money spent on local newspaper advertising must be at least twice the amount spent on radio advertising. A marketing consultant developed an index that measures audience exposure per dollar of advertising on a scale from 0 to 100, with higher values implying greater audience exposure. If the value of the index for local newspaper advertising is 50 and the value of the index for spot radio advertising is 80, how should the restaurant allocate its advertising budget to maximize the value of total audience exposure? a. Formulate a linear programming model that can be used to determine how the restaurant should allocate its advertising budget in order to maximize the value of total audience exposure. b. Develop a spreadsheet model and solve the problem using Excel Solver.arrow_forwardNozama.com Inc. sells consumer electronics over the Internet. For the next period, the budgeted cost of the sales order processing activity is 250,000 and 50,000 sales orders are estimated to be processed. a. Determine the activity rate of the sales order processing activity. b. Determine the amount of sales order processing cost associated with 30,000 sales orders.arrow_forwardAdam Corporation manufactures computer tables and has the following budgeted indirect manufacturing cost information for the next year: If Adam uses the step-down (sequential) method, beginning with the Maintenance Department, to allocate support department costs to production departments, the total overhead (rounded to the nearest dollar) for the Machining Department to allocate to its products would be: a. 407,500. b. 422,750. c. 442,053. d. 445,000.arrow_forward
 Cornerstones of Cost Management (Cornerstones Ser...AccountingISBN:9781305970663Author:Don R. Hansen, Maryanne M. MowenPublisher:Cengage Learning
 Managerial Accounting: The Cornerstone of Busines...AccountingISBN:9781337115773Author:Maryanne M. Mowen, Don R. Hansen, Dan L. HeitgerPublisher:Cengage Learning
 Managerial AccountingAccountingISBN:9781337912020Author:Carl Warren, Ph.d. Cma William B. TaylerPublisher:South-Western College Pub
 EBK CONTEMPORARY FINANCIAL MANAGEMENTFinanceISBN:9781337514835Author:MOYERPublisher:CENGAGE LEARNING - CONSIGNMENT
 Principles of Accounting Volume 2AccountingISBN:9781947172609Author:OpenStaxPublisher:OpenStax College
 Financial And Managerial AccountingAccountingISBN:9781337902663Author:WARREN, Carl S.Publisher:Cengage Learning,