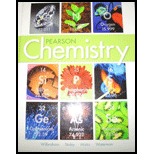
Interpretation: The graph which shows a directly proportional relationship is to be determined.
Concept introduction: One type of proportionality connection is referred to as direct proportion. In other words, if the value of one variable increases, the other variable will increase proportionally. Direct proportion is also referred to as direct variation.
Answer to Problem 7STP
The correct option is (A).
The directly proportional relationship graph is given below.

Explanation of Solution
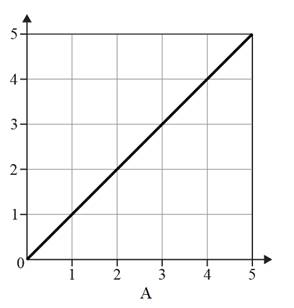
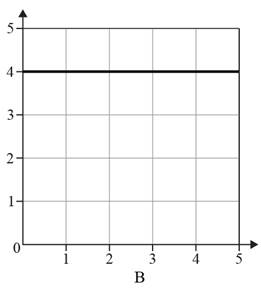
The given option of the graphs are as follows:
Reason for the correct option:
Directly proportional graphs are straight-line graphs. When the value of one variable increases, the value of the other variable also increases, and as a result, the straight line maintains the same gradient while one variable continues to get larger. On the other hand, the straight line approaches zero when the value of both variables decreases.
Hence, the correct option is (A).

Reason for the incorrect options
Directly proportional graphs are straight-line graphs. But other graphs are not straight lines.
Chapter 14 Solutions
Chemistry 2012 Student Edition (hard Cover) Grade 11

 ChemistryChemistryISBN:9781305957404Author:Steven S. Zumdahl, Susan A. Zumdahl, Donald J. DeCostePublisher:Cengage Learning
 ChemistryChemistryISBN:9781259911156Author:Raymond Chang Dr., Jason Overby ProfessorPublisher:McGraw-Hill Education
 Principles of Instrumental AnalysisChemistryISBN:9781305577213Author:Douglas A. Skoog, F. James Holler, Stanley R. CrouchPublisher:Cengage Learning
 Organic ChemistryChemistryISBN:9780078021558Author:Janice Gorzynski Smith Dr.Publisher:McGraw-Hill Education
 Chemistry: Principles and ReactionsChemistryISBN:9781305079373Author:William L. Masterton, Cecile N. HurleyPublisher:Cengage Learning
 Elementary Principles of Chemical Processes, Bind...ChemistryISBN:9781118431221Author:Richard M. Felder, Ronald W. Rousseau, Lisa G. BullardPublisher:WILEY