
Concept explainers
Videos
Write the conclusion might be drawn from each graph.
Answer to Problem 4CFU
It concludes that a good way to represent data.
It concludes that provides quantitative comparison and visualization.
It concludes that a good way to indicate data.
Explanation of Solution
Given information:
Select three graphs from newspapers or magazines.
Calculation:
All the graphs are taking from a link of newspaper,
First graph.
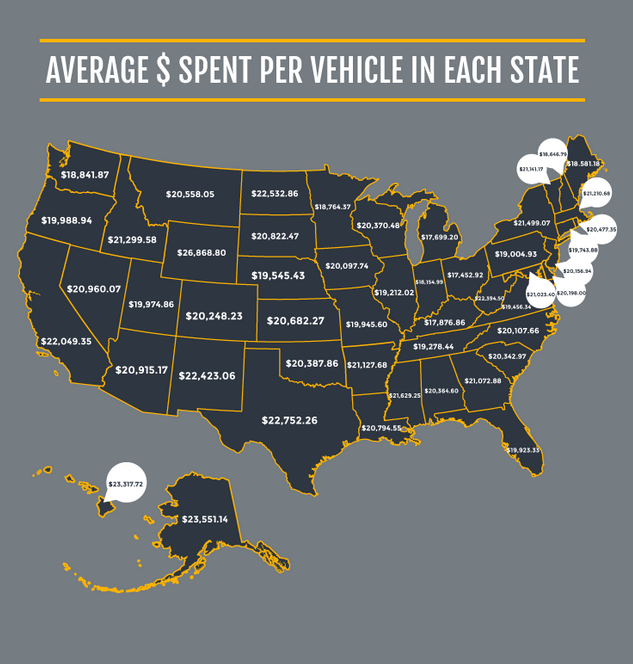
This graph lists the average amount of money spent per vechicle in each state in the US. It represents the cost geographically and categorically by state.
It conclude that a good way to represent data.
Second graph,

This graph highlights the top
It concludes that provides quantitative comparison and visualization.
Third graph,
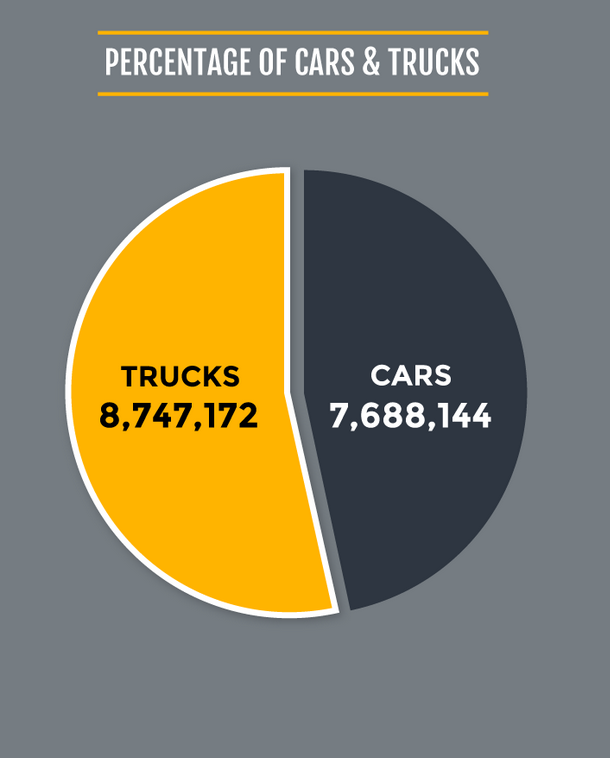
This is a pie chart demonstrating the relative number of cars and trucks in US. It shows that number of trucks are slightly more than number of cars.
It conclude that a good way to indicate data.
Chapter 14 Solutions
Advanced Mathematical Concepts: Precalculus with Applications, Student Edition
Additional Math Textbook Solutions
Single Variable Calculus: Early Transcendentals (2nd Edition) - Standalone book
Calculus: Early Transcendentals (2nd Edition)
University Calculus: Early Transcendentals (3rd Edition)
Calculus and Its Applications (11th Edition)


 Calculus: Early TranscendentalsCalculusISBN:9781285741550Author:James StewartPublisher:Cengage Learning
 Thomas' Calculus (14th Edition)CalculusISBN:9780134438986Author:Joel R. Hass, Christopher E. Heil, Maurice D. WeirPublisher:PEARSON
 Calculus: Early Transcendentals (3rd Edition)CalculusISBN:9780134763644Author:William L. Briggs, Lyle Cochran, Bernard Gillett, Eric SchulzPublisher:PEARSON
 Calculus: Early TranscendentalsCalculusISBN:9781319050740Author:Jon Rogawski, Colin Adams, Robert FranzosaPublisher:W. H. Freeman
 Calculus: Early Transcendental FunctionsCalculusISBN:9781337552516Author:Ron Larson, Bruce H. EdwardsPublisher:Cengage Learning