
EBK MODERN BUSINESS STATISTICS WITH MIC
5th Edition
ISBN: 9780100475038
Author: williams
Publisher: YUZU
expand_more
expand_more
format_list_bulleted
Concept explainers
Videos
Textbook Question
Chapter 14.3, Problem 19E
Sales Experience and Sales Performance. In exercise 7 a sales manager collected the following data on x = annual sales and y = years of experience. The estimated regression equation for these data is
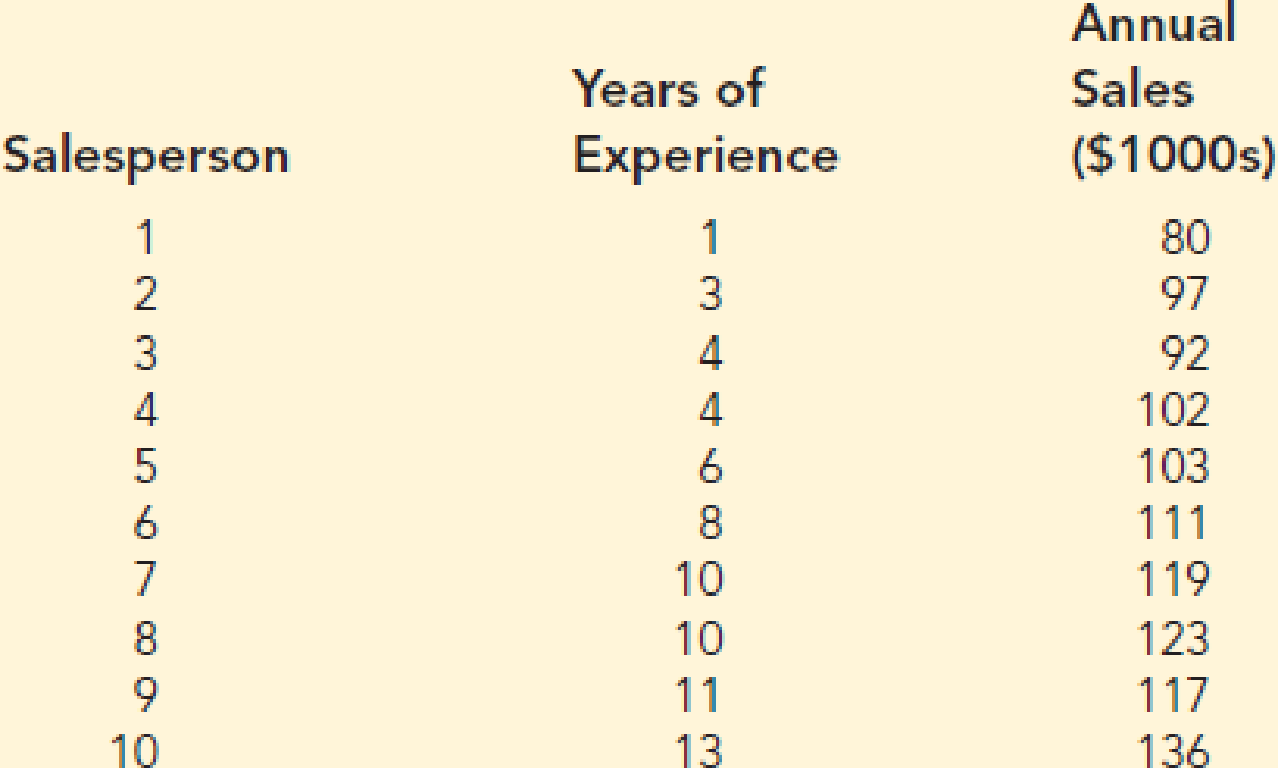
- a. Compute SST, SSR, and SSE.
- b. Compute the coefficient of determination r2. Comment on the goodness of fit.
- c. What is the value of the sample
correlation coefficient ?
Expert Solution & Answer
Want to see the full answer?
Check out a sample textbook solution
Students have asked these similar questions
The table below gives the age and bone density for five randomly selected women. Using this data, consider the equation of the regression line, yˆ=b0+b1x�^=�0+�1�, for predicting a woman's bone density based on her age. Keep in mind, the correlation coefficient may or may not be statistically significant for the data given. Remember, in practice, it would not be appropriate to use the regression line to make a prediction if the correlation coefficient is not statistically significant.
Age
44
52
54
62
70
Bone Density
346
342
332
325
323
Step 1 of 6: Find the estimated slope. Round your answer to three decimal places.
Step 2 of 6: Find the estimated y-intercept. Round your answer to three decimal places.
Step 3 of 6: According to the estimated linear model, if the value of the independent variable is increased by one unit, then the change in the dependent variable yˆ is given by?
a. b0
b. b1
c. x
d. y
Step 4 of 6: Find the estimated value of y when x=52. Round your…
The table below gives the list price and the number of bids received for five randomly selected items sold through online auctions. Using this data, consider the equation of the regression line, yˆ=b0+b1x for predicting the number of bids an item will receive based on the list price. Keep in mind, the correlation coefficient may or may not be statistically significant for the data given. Remember, in practice, it would not be appropriate to use the regression line to make a prediction if the correlation coefficient is not statistically significant.
Price in Dollars
3434
4040
4141
4444
4848
Number of Bids
11
22
33
44
55
Table
Step 4 of 6: Determine the value of the dependent variable yˆ at x=0.
a.) b0
b). b1
c). x
d). y
The table below gives the number of hours seven randomly selected students spent studying and their corresponding midterm exam grades. Using this data, consider the equation of the regression line, yˆ=b0+b1x�^=�0+�1�, for predicting the midterm exam grade that a student will earn based on the number of hours spent studying. Keep in mind, the correlation coefficient may or may not be statistically significant for the data given. Remember, in practice, it would not be appropriate to use the regression line to make a prediction if the correlation coefficient is not statistically significant.
Hours Studying
1
2
3
3.5
4
4.5
5
Midterm Grades
60
66
73
76
78
84
90
Table
Copy Data
Step 1 of 6:
Find the estimated slope. Round your answer to three decimal places.
Chapter 14 Solutions
EBK MODERN BUSINESS STATISTICS WITH MIC
Ch. 14.2 - Given are five observations for two variables, x...Ch. 14.2 - Given are five observations for two variables, x...Ch. 14.2 - Given are five observations collected in a...Ch. 14.2 - Retail and Trade: Female Managers. The following...Ch. 14.2 - Production Line Speed and Quality Control. Brawdy...Ch. 14.2 - The National Football League (NFL) records a...Ch. 14.2 - Sales Experience and Performance. A sales manager...Ch. 14.2 - Broker Satisfaction. The American Association of...Ch. 14.2 - Companies in the U.S. car rental market vary...Ch. 14.2 - Prob. 10E
Ch. 14.2 - Laptop Ratings. To help consumers in purchasing a...Ch. 14.2 - Prob. 12ECh. 14.2 - Distance and Absenteeism. A large city hospital...Ch. 14.2 - Using a global-positioning-system (GPS)-based...Ch. 14.3 - 15. The data from exercise 1...Ch. 14.3 - The data from exercise 2 follow.
The estimated...Ch. 14.3 - Prob. 17ECh. 14.3 - Price and Quality of Headphones. The following...Ch. 14.3 - Sales Experience and Sales Performance. In...Ch. 14.3 - Price and Weight of Bicycles. Bicycling, the...Ch. 14.3 - Cost Estimation. An important application of...Ch. 14.3 - 22. Refer to exercise 9, where the following data...Ch. 14.5 - The data from exercise 1 follow.
Compute the mean...Ch. 14.5 - The data from exercise 2 follow.
Compute the mean...Ch. 14.5 - The data from exercise 3 follow.
What is the...Ch. 14.5 - Prob. 26ECh. 14.5 - Prob. 27ECh. 14.5 - Broker Satisfaction Conclusion. In exercise 8,...Ch. 14.5 - Cost Estimation Conclusion. Refer to exercise 21,...Ch. 14.5 - Significance of Fleet Size on Rental Car Revenue....Ch. 14.5 - Significance of Racing Bike Weight on Price. In...Ch. 14.6 - 32. The data from exercise 1...Ch. 14.6 - 33. The data from exercise 2...Ch. 14.6 - Prob. 34ECh. 14.6 - 35. The following data are the monthly salaries y...Ch. 14.6 - 36. In exercise 7, the data on y = annual sales ($...Ch. 14.6 - In exercise 5, the following data on x = the...Ch. 14.6 - Prob. 38ECh. 14.6 - 39. In exercise 12, the following data on x =...Ch. 14.7 - The commercial division of a real estate firm...Ch. 14.7 - Following is a portion of the regression output...Ch. 14.7 - Out-of-state tuition and fees at the top graduate...Ch. 14.7 - Auto Racing Helmet. Automobile racing,...Ch. 14.8 - Prob. 45ECh. 14.8 - Prob. 46ECh. 14.8 - Prob. 47ECh. 14.8 - Prob. 48ECh. 14.8 - Prob. 49ECh. 14.9 - Consider the following data for two variables, x...Ch. 14.9 - Prob. 51ECh. 14.9 - Predicting Charity Expenses. Charity Navigator is...Ch. 14.9 - Many countries, especially those in Europe, have...Ch. 14.9 - Prob. 54ECh. 14 - The Dow Jones Industrial Average (DJIA) and the...Ch. 14 - Prob. 56SECh. 14 - Prob. 57SECh. 14 - Machine Maintenance. Jensen Tire & Auto is in the...Ch. 14 - Bus Maintenance. The regional transit authority...Ch. 14 - Reuters reported the market beta for Xerox was...Ch. 14 - Used Car Mileage and Price. The Toyota Camry is...Ch. 14 - Prob. 62SECh. 14 - One measure of the risk or volatility of an...Ch. 14 - As part of a study on transportation safety, the...Ch. 14 - Consumer Reports tested 166 different...Ch. 14 - When trying to decide what car to buy, real value...
Knowledge Booster


Learn more about
Need a deep-dive on the concept behind this application? Look no further. Learn more about this topic, statistics and related others by exploring similar questions and additional content below.Similar questions
- The table below gives the number of hours seven randomly selected students spent studying and their corresponding midterm exam grades. Using this data, consider the equation of the regression line, yˆ=b0+b1x�^=�0+�1�, for predicting the midterm exam grade that a student will earn based on the number of hours spent studying. Keep in mind, the correlation coefficient may or may not be statistically significant for the data given. Remember, in practice, it would not be appropriate to use the regression line to make a prediction if the correlation coefficient is not statistically significant. Hours Studying 11 1.51.5 2.52.5 33 44 4.54.5 55 Midterm Grades 6666 6969 7575 7979 9090 9595 9898 Find the estimated slope. Round your answer to three decimal places. Find the estimated y-intercept. Round your answer to three decimal places. Determine if the statement "Not all points predicted by the linear model fall on the same line" is true or false.…arrow_forwardThe table below gives the number of hours seven randomly selected students spent studying and their corresponding midterm exam grades. Using this data, consider the equation of the regression line, yˆ=b0+b1x�^=�0+�1�, for predicting the midterm exam grade that a student will earn based on the number of hours spent studying. Keep in mind, the correlation coefficient may or may not be statistically significant for the data given. Remember, in practice, it would not be appropriate to use the regression line to make a prediction if the correlation coefficient is not statistically significant. Hours Studying 1 2 3 3.5 4 4.5 5 Midterm Grades 60 66 73 76 78 84 90 Step 2 of 6: Find the estimated y-intercept. Round your answer to three decimal places. Step 3 of 6: Find the estimated value of y when x=2�=2. Round your answer to three decimal places. Step 4 of 6: Substitute the values you found in steps 1 and 2 into the equation for the regression line to find the estimated…arrow_forwardThe table below gives the list price and the number of bids received for five randomly selected items sold through online auctions. Using this data, consider the equation of the regression line, yˆ=b0+b1x, for predicting the number of bids an item will receive based on the list price. Keep in mind, the correlation coefficient may or may not be statistically significant for the data given. Remember, in practice, it would not be appropriate to use the regression line to make a prediction if the correlation coefficient is not statistically significant. Price in Dollars 24 28 34 40 43 Number of Bids 2 4 6 8 10 Find the estimated slope. Round your answer to three decimal places.arrow_forward
- The table below gives the list price and the number of bids received for five randomly selected items sold through online auctions. Using this data, consider the equation of the regression line, yˆ=b0+b1x, for predicting the number of bids an item will receive based on the list price. Keep in mind, the correlation coefficient may or may not be statistically significant for the data given. Remember, in practice, it would not be appropriate to use the regression line to make a prediction if the correlation coefficient is not statistically significant. Price in Dollars 124 143 158 160 196 Number of Bids 12 13 15 16 20 Table Step 1 of 6 : Find the estimated slope. Round your answer to three decimal places.arrow_forwardThe table below gives the list price and the number of bids received for five randomly selected items sold through online auctions. Using this data, consider the equation of the regression line, y^=b0+b1x, for predicting the number of bids an item will receive based on the list price. Keep in mind, the correlation coefficient may or may not be statistically significant for the data given. Remember, in practice, it would not be appropriate to use the regression line to make a prediction if the correlation coefficient is not statistically significant. Price in Dollars 29 33 34 36 46 Number of Bids 1 3 8 9 10 Summation Table x y xy x2 y2 Bid 1 29 1 29 841 1 Bid 2 33 3 99 1089 9 Bid 3 34 8 272 1156 64 Bid 4 36 9 324 1296 81 Bid 5 46 10 460 2116 100 Sum 178 31 1184 6498 255 Step 1 of 6: Find the estimated slope. Round your answer to three decimal places. Step 2 of 6: Find the estimated y-intercept. Round your answer to three decimal places. Step 3 of 6:…arrow_forwardThe table below gives the list price and the number of bids received for five randomly selected items sold through online auctions. Using this data, consider the equation of the regression line, yˆ=b0+b1x, for predicting the number of bids an item will receive based on the list price. Keep in mind, the correlation coefficient may or may not be statistically significant for the data given. Remember, in practice, it would not be appropriate to use the regression line to make a prediction if the correlation coefficient is not statistically significant. Price in Dollars 124 143 158 160 196 Number of Bids 12 13 15 16 20 Table Step 2 of 6 : Find the estimated y-intercept. Round your answer to three decimal places.arrow_forward
- The table below gives the list price and the number of bids received for five randomly selected items sold through online auctions. Using this data, consider the equation of the regression line, yˆ=b0+b1x, for predicting the number of bids an item will receive based on the list price. Keep in mind, the correlation coefficient may or may not be statistically significant for the data given. Remember, in practice, it would not be appropriate to use the regression line to make a prediction if the correlation coefficient is not statistically significant. Price in Dollars 116 168 170 184 188 Number of Bids 10 11 15 16 19 Table Step 2 of 6 : Find the estimated y-intercept and correlation . Round your answer to three decimal places. Answerarrow_forwardThe table below gives the list price and the number of bids received for five randomly selected items sold through online auctions. Using this data, consider the equation of the regression line, y^=b0+b1x, for predicting the number of bids an item will receive based on the list price. Keep in mind, the correlation coefficient may or may not be statistically significant for the data given. Remember, in practice, it would not be appropriate to use the regression line to make a prediction if the correlation coefficient is not statistically significant. Price in Dollars 101 126 154 172 185 Number of Bids 10 14 17 18 20 Summation Table x y xy x2 y2 Bid 1 101 10 1010 10201 100 Bid 2 126 14 1764 15876 196 Bid 3 154 17 2618 23716 289 Bid 4 172 18 3096 29584 324 Bid 5 185 20 3700 34225 400 Sum 738 79 12188 113602 1309 Step 1 of 6: Find the estimated slope. Round your answer to three decimal places. Step 2 of 6: Find the estimated y-intercept. Round your answer…arrow_forwardThe table below gives the list price and the number of bids received for five randomly selected items sold through online auctions. Using this data, consider the equation of the regression line, yˆ=b0+b1x, for predicting the number of bids an item will receive based on the list price. Keep in mind, the correlation coefficient may or may not be statistically significant for the data given. Remember, in practice, it would not be appropriate to use the regression line to make a prediction if the correlation coefficient is not statistically significant.arrow_forward
- The table below gives the list price and the number of bids received for five randomly selected items sold through online auctions. Using this data, consider the equation of the regression line, yˆ=b0+b1x, for predicting the number of bids an item will receive based on the list price. Keep in mind, the correlation coefficient may or may not be statistically significant for the data given. Remember, in practice, it would not be appropriate to use the regression line to make a prediction if the correlation coefficient is not statistically significant. Price in Dollars 21 23 29 43 50 Number of Bids 1 2 4 5 7 Step 1 of 6: Find the estimated slope. Round your answer to three decimal places. Step 2 of 6: Find the estimated y-intercept. Round your answer to three decimal places. Step 3 of 6: Determine the value of the dependent variable yˆ�^ at x=0. Step 4 of 6: According to the estimated linear model, if the value of the independent variable is increased by one…arrow_forwardThe table below gives the list price and the number of bids received for five randomly selected items sold through online auctions. Using this data, consider the equation of the regression line, yˆ=b0+b1x, for predicting the number of bids an item will receive based on the list price. Keep in mind, the correlation coefficient may or may not be statistically significant for the data given. Remember, in practice, it would not be appropriate to use the regression line to make a prediction if the correlation coefficient is not statistically significant. Price in Dollars 106 108 117 181 193 Number of Bids 10 15 16 17 18 Table Find the estimated y-intercept and correlation coefficient ..Round your answer to three decimal places.arrow_forwardThe table below gives the list price and the number of bids received for five randomly selected items sold through online auctions. Using this data, consider the equation of the regression line, yˆ=b0+b1x, for predicting the number of bids an item will receive based on the list price. Keep in mind, the correlation coefficient may or may not be statistically significant for the data given. Remember, in practice, it would not be appropriate to use the regression line to make a prediction if the correlation coefficient is not statistically significant. Price in Dollars 120 127 129 175 190 Number of Bids 11 15 17 18 19 Table Step 6 of 6 : Find the value of the coefficient of determination. Round your answer to three decimal placesarrow_forward
arrow_back_ios
SEE MORE QUESTIONS
arrow_forward_ios
Recommended textbooks for you
 Glencoe Algebra 1, Student Edition, 9780079039897...AlgebraISBN:9780079039897Author:CarterPublisher:McGraw Hill
Glencoe Algebra 1, Student Edition, 9780079039897...
Algebra
ISBN:9780079039897
Author:Carter
Publisher:McGraw Hill
Correlation Vs Regression: Difference Between them with definition & Comparison Chart; Author: Key Differences;https://www.youtube.com/watch?v=Ou2QGSJVd0U;License: Standard YouTube License, CC-BY
Correlation and Regression: Concepts with Illustrative examples; Author: LEARN & APPLY : Lean and Six Sigma;https://www.youtube.com/watch?v=xTpHD5WLuoA;License: Standard YouTube License, CC-BY