
Mathematical Statistics with Applications
7th Edition
ISBN: 9780495110811
Author: Dennis Wackerly, William Mendenhall, Richard L. Scheaffer
Publisher: Cengage Learning
expand_more
expand_more
format_list_bulleted
Videos
Textbook Question
Chapter 14.5, Problem 26E
A manufacturer of buttons wished to determine whether the fraction of defective buttons produced by three machines varied from machine to machine. Samples of 400 buttons were selected from each of the three machines, and the number of defectives were counted for each sample. The results are shown in the accompanying table. Do these data present sufficient evidence to indicate that the fraction of defective buttons varied from machine to machine?
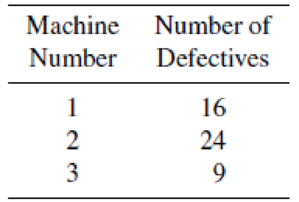
a Test, using α = .05, with a χ2 test.
b Test, using α = .05, with a likelihood ratio test. [Hint: Refer to Exercise 10.106.]11
Expert Solution & Answer
Want to see the full answer?
Check out a sample textbook solution
Students have asked these similar questions
An SRS of 100 flights by Speedy Airlines showed that 64 were on time. An SRS of 100 flights by Happy Airlines showed that 80 were on time. Let pS be the proportion of on-time flights for all Speedy Airline flights, and let pH be the proportion of all on-time flights for all Happy Airlines flights. Is there evidence of a difference in the on-time rate for the two airlines? To determine this, you test the hypotheses H0 : pS – pH 0, Ha : pS – pH 0. The P-value of your test is 0.0117. Which of the following is an appropriate interpretation of the P-value? a. If the on-time rates for the two airlines are equal, there is a 0.0117 probability of getting samples with a difference as far or farther from zero as these samples. b. If the on-time rates for the two airlines are not equal, the probability of getting samples with a difference as far or farther from zero as these samples is 0.9883. c. The probability of making a Type I error is 0.0117. d. The probability of making a Type II error…
in a city a,20% of a random sample of a 900 school boys had a slight certain physical defect. in another city b,18.5% of a random sample of 1600 school boys had the same defect.is the difference between the proportions is significant?
A researcher obtained a result of t(9)=1.22, p>.05 for their study using a one sample t-test. Are the results significant using an alpha level of .05 and how many participants were in the group?
Chapter 14 Solutions
Mathematical Statistics with Applications
Ch. 14.3 - Historically, the proportions of all Caucasians in...Ch. 14.3 - Prob. 2ECh. 14.3 - Prob. 3ECh. 14.3 - Prob. 4ECh. 14.3 - Prob. 5ECh. 14.3 - Prob. 6ECh. 14.3 - Prob. 7ECh. 14.3 - Prob. 8ECh. 14.3 - Prob. 9ECh. 14.3 - Prob. 10E
Ch. 14.3 - The data in the following table are the frequency...Ch. 14.4 - On the 40th anniversary of President John F....Ch. 14.4 - A study was conducted by Joseph Jacobson and Diane...Ch. 14.4 - Suppose that the entries in a contingency table...Ch. 14.4 - A survey to explore the relationship between...Ch. 14.4 - Prob. 17ECh. 14.4 - Prob. 18ECh. 14.4 - The results of a study suggest that the initial...Ch. 14.4 - Refer to Exercise 14.10. Test the hypothesis, at...Ch. 14.4 - An interesting and practical use of the 2 test...Ch. 14.5 - A study to determine the effectiveness of a drug...Ch. 14.5 - The 2 test used in Exercise 14.22 is equivalent to...Ch. 14.5 - How do Americans in the sandwich generation...Ch. 14.5 - Does education really make a difference in how...Ch. 14.5 - A manufacturer of buttons wished to determine...Ch. 14.5 - Traditionally, U.S. labor unions have been content...Ch. 14.5 - Prob. 29ECh. 14.5 - Refer to Exercise 14.29. Estimate the difference...Ch. 14.5 - A survey was conducted to investigate interest of...Ch. 14 - Prob. 32SECh. 14 - A survey was conducted to determine student,...Ch. 14 - How would you rate yourself as a driver? According...Ch. 14 - Prob. 35SECh. 14 - Knee injuries are a major problem for athletes in...Ch. 14 - It is often not clear whether all properties of a...Ch. 14 - Prob. 39SECh. 14 - Prob. 40SECh. 14 - Prob. 41SECh. 14 - Prob. 42SECh. 14 - Prob. 43SE
Knowledge Booster


Learn more about
Need a deep-dive on the concept behind this application? Look no further. Learn more about this topic, statistics and related others by exploring similar questions and additional content below.Similar questions
- A sample of 12 radon detectors of a certain type was selected, and each was exposed to 100 pCi/L of radon. The resulting readings were as follows: 105.6 90.9 91.2 96.9 96.5 91.3 100.1 105.5 99.6 107.7 103.3 92.4 Does this data suggest that the population mean reading under these conditions differ from 100? (a) State the null and alternative hypotheses. (b) Calculate, correct to 2 decimal places, (i) the sample mean, x ; and (ii) the sample standard deviation, s. (c) Evaluate the appropriate test statistic. (d) Test these hypotheses at 0.05 level of significance.arrow_forwarda major cereal manufacturer is awarding prize certificates in its #1 cereal. a random sample of 60 cereal boxes is selected and 5 are found to contain prize certificates. find the 90% C.I for the true proportion of prize certificates.arrow_forwardAn article includes the accompanying data on compression strength (lb) for a sample of 12-oz aluminum cans filled with strawberry drink and another sample filled with cola. Beverage Sample Size Sample Mean Sample SD Strawberry Drink 10 535 24 Cola 10 559 15 Does the data suggest that the extra carbonation of cola results in a higher average compression strength? Base your answer on a P-value. (Use ? = 0.05.) State the relevant hypotheses. (Use ?1 for the strawberry drink and ?2 for the cola.) H0: ?1 − ?2 = 0Ha: ?1 − ?2 ≥ 0H0: ?1 − ?2 = 0Ha: ?1 − ?2 ≠ 0 H0: ?1 − ?2 = 0Ha: ?1 − ?2 < 0H0: ?1 − ?2 = 0Ha: ?1 − ?2 > 0 Calculate the test statistic and determine the P-value. (Round your test statistic to one decimal place and your P-value to three decimal places.) t = P-value = State the conclusion in the problem context. Reject H0. The data suggests that cola has a higher average compression strength than the strawberry drink.Reject H0. The…arrow_forward
- Each person in a random sample of 400 residents in a major town was asked whether they had ever been bitten by a dog. 85 answered yes. We are testing the following pair of hypotheses for the value of p, the true proportion of residents in the town who have been bitten by a dog: H0: p = 0.25 Ha: p < 0.25 We are using (alpha) α = 0.05. What is the P-value of this test? Select one: a.0.050 b.0.958 c.0.042 d.0.033arrow_forwardAssume that ρxy = .30 between weight and exercise for the population of normal adults. However, a researcher believes the relationship is stronger for children. The researcher tests a sample of 28 children and obtains an rxy = .47. Does this result support the researcher’s belief? Conduct an appropriate statistical test using an alpha level of .05.arrow_forwardA sample of 12 radon detectors of a certain type was selected, and each was exposed to 100 pCi/L of radon. The resulting readings were as follows: 104.3 89.6 89.9 95.6 95.2 90.0 98.8 103.7 98.3 106.4 102.0 91.1 a)Does this data suggest that the population mean reading under these conditions differs from 100? State and test the appropriate hypotheses using =.05. b) Suppose that prior to the experiment, a value of teta=7.5 had been assumed. How many determinations would then have been appropriate to obtain beta=.10 for the alternative u=95 ?arrow_forward
- - Let I = 1.135013 be the sample mean of an iid sample r1,..., x50 from a gamma population Gamma(1, 3). Here B > 0 is the unknown parameter of interest. Construct an approximate 95%-CI for B.arrow_forwardWhat is the z-score if |u = 89 , sigma=11.5, and x = 82?arrow_forwardA fisheries biologist collected a random sample of fish from a lake and conducted a chi-square goodness-of-fit test to see if the distribution of fish changed over time. The table below shows the distribution of fish that were put into the lake when it was originally stocked. Fish Type Trout Bass Perch Sunfish Catfish Percent 25% 25% 20% 15% 15% The biologist found evidence to reject the null hypothesis in favor of the alternative hypothesis. Which of the following represents the alternative hypothesis of the test?arrow_forward
- What is the z-score if mu = 89 , sigma=11.5, and x = 82 ?arrow_forwardConsider a study using a between-groups design with between-groups df = 3 and within-groups df = 4. Given an F ratio of 6.8, the researcher should: a. reject the null hypothesis if alpha is .05 but fail to reject if alpha of .01 b. reject the null hypothesis if alpha is .01 but fail to reject if alpha of .05 c. reject the null for both alpha = .01 or alpha = .05 d. fail to reject the null hypothesis whether alpha is .01 or .05arrow_forwardFill the chi square for Cross 1 and Cross 2 from the following data in the attached image: Cross 1: Phenotypes Ratio Observed Expected (O-E)2/E Totals X2 = Cross 2: Phenotypes Ratio Observed Expected (O-E)2/E Totals X2 =arrow_forward
arrow_back_ios
SEE MORE QUESTIONS
arrow_forward_ios
Recommended textbooks for you
 Algebra & Trigonometry with Analytic GeometryAlgebraISBN:9781133382119Author:SwokowskiPublisher:Cengage
Algebra & Trigonometry with Analytic Geometry
Algebra
ISBN:9781133382119
Author:Swokowski
Publisher:Cengage
Hypothesis Testing using Confidence Interval Approach; Author: BUM2413 Applied Statistics UMP;https://www.youtube.com/watch?v=Hq1l3e9pLyY;License: Standard YouTube License, CC-BY
Hypothesis Testing - Difference of Two Means - Student's -Distribution & Normal Distribution; Author: The Organic Chemistry Tutor;https://www.youtube.com/watch?v=UcZwyzwWU7o;License: Standard Youtube License