
Mathematical Statistics with Applications
7th Edition
ISBN: 9781133384380
Author: Dennis Wackerly; William Mendenhall; Richard L. Scheaffer
Publisher: Cengage Learning US
expand_more
expand_more
format_list_bulleted
Concept explainers
Videos
Textbook Question
Chapter 14.5, Problem 28E
Traditionally, U.S. labor unions have been content to leave the management of companies to managers and corporate executives. In Europe, worker participation in management decision making is an accepted idea that is becoming increasingly popular. To study the effect of worker participation, 100 workers were interviewed in each of two separate German manufacturing plants. One plant had active worker participation in managerial decision making; the other plant did not. Each selected worker was asked whether he or she approved of the managerial decisions made within the plant. The results follow.
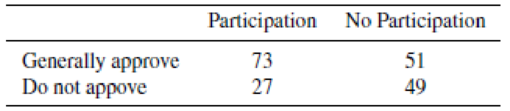
- a Do the data indicate a difference in the proportions of workers in the two plants who generally approve of managerial decisions? Test at the .05 significance level using the χ2 test.
- b Construct a 95% lower confidence bound for the difference in the proportion of workers who approve of managerial decisions in the plants with and without worker participation. Does the resulting confidence bound indicate that a greater proportion of workers approve of managerial decisions in the plant with active worker participation? Why?
- c Could the conclusion that you reached in part (b) have resulted from the χ2 test implemented in part (a)? Why?
Expert Solution & Answer

Trending nowThis is a popular solution!

Students have asked these similar questions
Izmir University of Economics students evaluate the social services in school by a questionnaire within three rating categories (A, B, and C). Suppose that in the past year, of the questionnaires on social service issues throughout the university, 50% were rated
A, 30% were rated B, and 20% were rated C. Of the questionnaires rated A, 30% were answered by the engineering students, 30% by students from business faculty, and 40% by fine arts students. Of the questionnaires rated B, 50% were answered by
engineering students, 10% by students from business faculty, and 40% by fine arts students. Of the questionnaires rated C, 80% were answered by engineering students, 5% by students from business faculty, and 15% by fine arts students. Complete (a)
through (c) below.
a. If a new questionnaire is answered by an engineering student, what is the probability that it will receive an A rating?
(Round to three decimal places as needed.)
b. What proportion of questionnaires are answered by…
An industrial/organizational psychologist wants to improve worker productivity for a client firm, but first he needs to gain a better understanding of the life of the typical white-collar professional. Fortunately, he has access to the 2008 Workplace Productivity Survey, commissioned by LexisNexis and prepared by WorldOne Research, which surveyed a sample of 650 white-collar professionals (250 legal professionals and 400 other professionals).
One of the survey questions was, “How many work-related emails do you receive during a typical workday?” For the subsample of legal professionals (n = 250), the mean response was M = 36.7 emails, with a sample standard deviation of s = 21.2 emails.
The psychologist can be 99% confident that the interval from to includes the unknown population mean µ.
Normally the psychologist will not know the value of the population mean. But consider the (unrealistic) scenario that a census of legal professionals is conducted. The census reveals…
The Consumer Reports Restaurant Customer Satisfaction Survey is based upon 148,599 visits to full-service restaurant chains (Consumer Reports website). One of the variables in the study is meal price, the average amount paid per
person for dinner and drinks, minus the tip. Suppose a reporter for the Sun Coast Times thought that it would be of interest to her readers to conduct a similar study for restaurants located on the Grand Strand section in Myrtle Beach,
South Carolina. The reporter selected a sample of 8 seafood restaurants, 8 Italian restaurants, and 8 steakhouses. The following data show the meal prices ($) obtained for the 24 restaurants sampled. Use a = 0.05 to test whether
there is a significant difference among the mean meal price for the three types of restaurants.
Source
Sum of Squares Degrees
Mean Square
F
P-value
of Variation (to whole number) of Freedom (to 2 decimals) (to 2 decimals) (to 4 decimals)
X
X
(X)
*
X
*
*
Treatments
Error
Total
The p-value is less than 0.01…
Chapter 14 Solutions
Mathematical Statistics with Applications
Ch. 14.3 - Historically, the proportions of all Caucasians in...Ch. 14.3 - Prob. 2ECh. 14.3 - Prob. 3ECh. 14.3 - Prob. 4ECh. 14.3 - Prob. 5ECh. 14.3 - Prob. 6ECh. 14.3 - Prob. 7ECh. 14.3 - Prob. 8ECh. 14.3 - Prob. 9ECh. 14.3 - Prob. 10E
Ch. 14.3 - The data in the following table are the frequency...Ch. 14.4 - On the 40th anniversary of President John F....Ch. 14.4 - A study was conducted by Joseph Jacobson and Diane...Ch. 14.4 - Suppose that the entries in a contingency table...Ch. 14.4 - A survey to explore the relationship between...Ch. 14.4 - Prob. 17ECh. 14.4 - Prob. 18ECh. 14.4 - The results of a study suggest that the initial...Ch. 14.4 - Refer to Exercise 14.10. Test the hypothesis, at...Ch. 14.4 - An interesting and practical use of the 2 test...Ch. 14.5 - A study to determine the effectiveness of a drug...Ch. 14.5 - The 2 test used in Exercise 14.22 is equivalent to...Ch. 14.5 - How do Americans in the sandwich generation...Ch. 14.5 - Does education really make a difference in how...Ch. 14.5 - A manufacturer of buttons wished to determine...Ch. 14.5 - Traditionally, U.S. labor unions have been content...Ch. 14.5 - Prob. 29ECh. 14.5 - Refer to Exercise 14.29. Estimate the difference...Ch. 14.5 - A survey was conducted to investigate interest of...Ch. 14 - Prob. 32SECh. 14 - A survey was conducted to determine student,...Ch. 14 - How would you rate yourself as a driver? According...Ch. 14 - Prob. 35SECh. 14 - Knee injuries are a major problem for athletes in...Ch. 14 - It is often not clear whether all properties of a...Ch. 14 - Prob. 39SECh. 14 - Prob. 40SECh. 14 - Prob. 41SECh. 14 - Prob. 42SECh. 14 - Prob. 43SE
Knowledge Booster


Learn more about
Need a deep-dive on the concept behind this application? Look no further. Learn more about this topic, statistics and related others by exploring similar questions and additional content below.Similar questions
- The Consumer Reports Restaurant Customer Satisfaction Survey is based upon 148,599 visits to full-service restaurant chains (Consumer Reports website). One of the variables in the study is meal price, the average amount paid per person for dinner and drinks, minus the tip. Suppose a reporter for the Sun Coast Times thought that it would be of interest to her readers to conduct a similar study for restaurants located on the Grand Strand section in Myrtle Beach, South Carolina. The reporter selected a sample of 8 seafood restaurants, 8 Italian restaurants, and 8 steakhouses. The following data show the meal prices ($) obtained for the 24 restaurants sampled. Use a = 0.05 to test whether there is a significant difference among the mean meal price for the three types of restaurants. Treatments Error Total Source Sum of Squares Degrees Mean Square F P-value of Variation (to whole number) of Freedom (to 2 decimals) (to 2 decimals) (to 4 decimals) The p-value is - Select your answer - What is…arrow_forwardThe Consumer Reports Restaurant Customer Satisfaction Survey is based upon 148,599 visits to full-service restaurant chains (Consumer Reports website). One of the variables in the study is meal price, the average amount paid per person for dinner and drinks, minus the tip. Suppose a reporter for the Sun Coast Times thought that it would be of interest to her readers to conduct a similar study for restaurants located on the Grand Strand section in Myrtle Beach, South Carolina. The reporter selected a sample of 8 seafood restaurants, 8 Italian restaurants, and 8 steakhouses. The following data show the meal prices ($) obtained for the 24 restaurants sampled. Use a = 0.05 to test whether there is a significant difference among the mean meal price for the three types of restaurants. Italian Seafood Steakhouse $ 10 $ 17 $ 26 $ 12 $ 17 $ 17 $ 16 $ 17 $ 21 $ 18 $ 28 $ 24 $ 17 $ 24 $ 23 $ 18 $ 13 $ 24 $ 17 $ 19 $ 26 $ 23 $ 18 $ 29 Source Sum of Squares Degrees Mean Square p -value (to whole…arrow_forwardThe Consumer Reports Restaurant Customer Satisfaction Survey is based upon 148,599 visits to full-service restaurant chains (Consumer Reports website). One of the variables in the study is meal price, the average amount paid per person for dinner and drinks, minus the tip. Suppose a reporter for the Sun Coast Times thought that it would be of interest to her readers to conduct a similar study for restaurants located on the Grand Strand section in Myrtle Beach, South Carolina. The reporter selected a sample of 8 seafood restaurants, 8 Italian restaurants, and 8 steakhouses. The following data show the meal prices ($) obtained for the 24 restaurants sampled. Use a = 0.05 to test whether there is a significant difference among the mean meal price for the three types of restaurants. Please answer the questions in the image.arrow_forward
- Health care issues are receiving much attention in both academic and political arenas. A sociologist recently conducted a survey of citizens over 60 years of age whose net worth is too high to qualify for government health care but who have no private health insurance. The ages of 25 uninsured senior citizens were as follows:68,73,66,76,86,74,61,89,65,90,69,92,76,62,81,63,68,81,70,73,60,87,75,64,82 Suppose the mean and standard deviation are 74.0 and 9.7, respectively. If we assume that the distribution of ages is bell shaped, what percentage of the respondents will be between 64.3 and 93.4 years old? Group of answer choicesarrow_forwardThe Consumer Reports Restaurant Customer Satisfaction Survey is based upon 148,599 visits to full-service restaurant chains. One of the variables in the study is meal price, the average amount paid per person for dinner and drinks, minus the tip. Suppose a reporter for the Sun Coast Times thought that it would be of interest to her readers to conduct a similar study for restaurants located on the Grand Strand section in Myrtle Beach, South Carolina. The reporter selected a sample of 8 seafood restaurants, 8 Italian restaurants, and 8 steakhouses. The data in Sheet 7 show the meal prices ($) obtained for the 24 restaurants sampled. Use alpha = 0.05 to test whether there is a significant difference among the mean meal price for the three types of restaurants. Sheet 7 Italian Seafood Steakhouse 12 16 24 13 18 19 15 17 23 17 26 25 18 23 21 20 15 22 17 19 27 24 18 31 Select one: a) Fstat = 7.33 > Fcrit = 3.47, insufficient evidence to reject the null…arrow_forwardAccording to a Gallup poll in October 2015, having young children at home greatly influences whether women in the U.S. prefer to stay at home or work outside of it. More than half of women, 56%, who have a child younger than 18 would ideally like to stay home and care for their house and family, while 58% of those without young children would rather work outside the home. Having young children makes little difference in men's preferences, with close to three-quarters preferring to work regardless of their parenting status. Gallup states that their method has a margin of error of 0.031.(a) Give a point estimate for the proportion of all US women with a child under 18 that would like to stay at home.(b) Give an interval estimate for the proportion of all US women with a child under 18 that would like to stay at home. Use three decimal places in your answer.( , )(c) What is the difference between a point estimate and an interval estimate?arrow_forward
- Despite the availability of several modes of transportation, including metro and ride-booking services, most people in the Washington, D.C., area continue to drive their own cars to get around (The Washington Post, June 6, 2019). According to a survey, 62% of area adults use their own cars daily. Suppose only 38% of the area’s adults under 35 use their own cars daily. It is known that 43% of the area’s adults are under 35. What is the probability that a Washington, D.C., area adult is under 35 and uses his/her own car daily? If a Washington, D.C., area adult uses his/her own car daily, what is the probability that he/she is under 35?arrow_forwardRebecca Chory, Ph.D., now an associate professor of communication at West Virginia University, began studying the effect of such portrayals on patients' attitudes toward physicians. Using a survey of 300 undergraduate students, she compared perceptions of physicians in 1992—the end of the era when physicians were shown as all-knowing, wise father figures—with those in 1999, when shows such as ER and Chicago Hope (1994–2000) were continuing the transformation to showing the private side and lives of physicians, including vivid demonstrations of their weaknesses and insecurities. Dr. Chory found that, regardless of the respondents' personal experience with physicians, those who watched certain kinds of television had declining perceptions of physicians' composure and regard for others. Her results indicated that the more prime time physician shows that people watched in which physicians were the main characters, the more uncaring, cold, and unfriendly the respondents thought physicians…arrow_forwardMixed gender decision-making groups. In business, a group of executives is often assigned to make key decisions. The American Journal of Political Science (April 2014) pub- lished a study on a woman's impact on mixed-gender delib- erating groups. The researchers randomly assigned subjects to one of several 5-member decision-making groups. The groups' gender composition varied as follows: 0 females, 1 female, 2 females, 3 females, 4 females, or 5 females. Each group was then randomly assigned to utilize one of two types of decision rules: unanimous or majority rule. Ten groups were created for each of the 6 × 2 = 12 combina- tions of gender composition and decision rule. One vari- able of interest, measured for each group, was the number of words spoken by women on a certain topic per 1,000 total words spoken during the deliberations. a. Why is this experiment considered a designed study? b. Identify the experimental unit and dependent variable in this study. c. Identify the factors for…arrow_forward
- As you read about each study, (a) classify the type of research that it reflects, and (b) identify the kinds of conclusions that might reasonably be drawn from the results. The director of computer technology in Emerson School District wants to gather information about the use of technology-based instruction in language arts and literature classes in the district's middle schools and high schools. For her study, the director identifies five of the top teachers in these content areas. She visits and observes each teacher's classes on three different days and subsequently interviews each teacher. Then she summarizes the ways that these teachers incorporate the use of technology into their lessons and their students' activities. The director also summarizes teachers' beliefs about the roles of technology in students' learning and motivation. (a) Classify the research as one of the following: Quantitative/descriptive Quantitative/correlational…arrow_forwardThe Bureau of Transportation Statistics reports on-time performance for airlines at major U.S. airports. JetBlue, United, and US Airways share Terminal C at Boston’s Logan Airport. The percentage of on-time flights reported for a sample month were 76.8% for JetBlue, 71.5% for United, and 82.2% for US Airways. Assume that 30% of the flights arriving at Terminal C are JetBlue flights, 32% are United flights, and 38% US Airways flights. Develop a joint probability table with three rows (the airlines) and two columns (on- time and late). An announcement is made that Flight 1382 will be arriving at gate 20 of Terminal C. What is the probability that Flight 1382 will arrive on time? What is the most likely airline for Flight 1382? What is the probability that Flight 1382 is by this airline? Suppose that an announcement is made saying that Flight 1382 will now be arriving late. What is the most likely airline for this flight? What is the probability that Flight 1382 is by this…arrow_forwardAn industrial/organizational psychologist wants to improve worker productivity for a client firm, but first he needs to gain a better understanding of the life of the typical white-collar professional. Fortunately, he has access to the 2008 Workplace Productivity Survey, commissioned by LexisNexis and prepared by WorldOne Research, which surveyed a sample of 650 white-collar professionals (250 legal professionals and 400 other professionals). One of the survey questions was, “How many hours do you work at your job on a typical workday?” For the subsample of legal professionals (n = 250), the mean response was M = 9.0 hours, with a sample standard deviation of s = 10.4 hours. The estimated standard error is sMM = . Use the following Distributions tool to develop a 99% confidence interval estimate of the mean number of hours legal professionals work on a typical workday. The psychologist can be 99% confident that the interval from to includes the unknown…arrow_forward
arrow_back_ios
SEE MORE QUESTIONS
arrow_forward_ios
Recommended textbooks for you
 Glencoe Algebra 1, Student Edition, 9780079039897...AlgebraISBN:9780079039897Author:CarterPublisher:McGraw Hill
 Holt Mcdougal Larson Pre-algebra: Student Edition...AlgebraISBN:9780547587776Author:HOLT MCDOUGALPublisher:HOLT MCDOUGAL
 Big Ideas Math A Bridge To Success Algebra 1: Stu...AlgebraISBN:9781680331141Author:HOUGHTON MIFFLIN HARCOURTPublisher:Houghton Mifflin Harcourt
Glencoe Algebra 1, Student Edition, 9780079039897...
Algebra
ISBN:9780079039897
Author:Carter
Publisher:McGraw Hill
Holt Mcdougal Larson Pre-algebra: Student Edition...
Algebra
ISBN:9780547587776
Author:HOLT MCDOUGAL
Publisher:HOLT MCDOUGAL
Big Ideas Math A Bridge To Success Algebra 1: Stu...
Algebra
ISBN:9781680331141
Author:HOUGHTON MIFFLIN HARCOURT
Publisher:Houghton Mifflin Harcourt
Statistics 4.1 Point Estimators; Author: Dr. Jack L. Jackson II;https://www.youtube.com/watch?v=2MrI0J8XCEE;License: Standard YouTube License, CC-BY
Statistics 101: Point Estimators; Author: Brandon Foltz;https://www.youtube.com/watch?v=4v41z3HwLaM;License: Standard YouTube License, CC-BY
Central limit theorem; Author: 365 Data Science;https://www.youtube.com/watch?v=b5xQmk9veZ4;License: Standard YouTube License, CC-BY
Point Estimate Definition & Example; Author: Prof. Essa;https://www.youtube.com/watch?v=OTVwtvQmSn0;License: Standard Youtube License
Point Estimation; Author: Vamsidhar Ambatipudi;https://www.youtube.com/watch?v=flqhlM2bZWc;License: Standard Youtube License