
Mathematical Statistics with Applications
7th Edition
ISBN: 9781133384380
Author: Dennis Wackerly; William Mendenhall; Richard L. Scheaffer
Publisher: Cengage Learning US
expand_more
expand_more
format_list_bulleted
Concept explainers
Videos
Textbook Question
Chapter 14.4, Problem 16E
A survey to explore the relationship between voters’ church-attendance patterns and their choice of presidential candidate was reported in the Riverside Press-Enterprise prior to the 2004 presidential election. Voters were asked how often they attended church services and which of the two major presidential candidates (George W. Bush or John Kerry) they intended to vote for in the election. The results of a similar survey are contained in the following table.
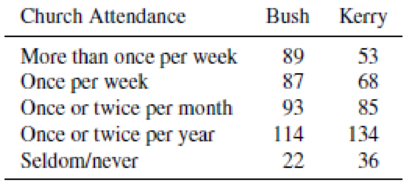
- a Is there sufficient evidence to indicate dependence between reported frequency of church attendance and choice of presidential candidate in the 2004 presidential election? Test at the .05 level of significance. Place bounds on the attained significance level.
- b Give a 95% confidence interval for the proportion of individuals who report attending church at least once per week.
Expert Solution & Answer
Want to see the full answer?
Check out a sample textbook solution
Students have asked these similar questions
Pew Research Center is a nonpartisan polling organization that provides information about issues, attitudes, and trends shaping America. In a poll, Pew researchers found that 73% of teens aged 13–17 have a smartphone, 15% have a basic phone and 12% have no phone. The study also asked the respondents how they communicated with their closest friend. Of those with a smartphone, 58% responded texting, 17% social media and 10% phone calls. Of those with no smartphone, 25% responded texting, 29% social media and 21% phone calls.†
Do you think the Pew researchers conducted a census or a sample survey to obtain their results? Why?
Pew Research conducted a sample survey. A census would not have provided realistic information on such a large population.
Pew Research conducted a census. A sample survey would not have provided realistic information on such a large population.
Pew Research conducted a census. It would not have been practical to conduct a sample survey on such a large…
A survey of a group's web habits for the past month obtained the following information.38% visited Facebook.38% visited LinkedIn.42% visited Google.23% visited Facebook and LinkedIn.24% visited Facebook and Google.22% visited LinkedIn and Google.15% visited all three sites.Find the percentage that visited none of these three sites last month. %
Submit QuestionQuestion 9
In a 2018 study, Phoenix Marketing International identified Bridgeport, Connecticut; San Jose, California; Washington, DC; and Lexington Park, Maryland, as the four U.S. cities with
the highest percentage of millionaires (Kiplinger website). Consider a sample of data that show the following number of millionaires for samples of individuals from each of the four
cities.
City
Bridgeport,
San Jose,
Washington,
Lexington Park,
Millionaire
CT
CA
D.C.
MD
Yes
45
35
35
32
No
455
265
365
368
a. What is the estimate of the percentage of millionaires in each of these cities (to 1 decimal)?
Bridgeport,
San Jose,
Washington,
Lexington Park,
CT
CA
D.C.
MD
Percentage, %
b. Using a = 0.05 level of significance, test for the equality of the population proportion of millionaires for these four cities. What is the p-value?
Compute the value of the x test statistic (to 3 decimals).
Use Table 3 of Appendix B to find the p-value.
The p-value is - Select your answer -
- Select your answer-
What is your c…
Chapter 14 Solutions
Mathematical Statistics with Applications
Ch. 14.3 - Historically, the proportions of all Caucasians in...Ch. 14.3 - Prob. 2ECh. 14.3 - Prob. 3ECh. 14.3 - Prob. 4ECh. 14.3 - Prob. 5ECh. 14.3 - Prob. 6ECh. 14.3 - Prob. 7ECh. 14.3 - Prob. 8ECh. 14.3 - Prob. 9ECh. 14.3 - Prob. 10E
Ch. 14.3 - The data in the following table are the frequency...Ch. 14.4 - On the 40th anniversary of President John F....Ch. 14.4 - A study was conducted by Joseph Jacobson and Diane...Ch. 14.4 - Suppose that the entries in a contingency table...Ch. 14.4 - A survey to explore the relationship between...Ch. 14.4 - Prob. 17ECh. 14.4 - Prob. 18ECh. 14.4 - The results of a study suggest that the initial...Ch. 14.4 - Refer to Exercise 14.10. Test the hypothesis, at...Ch. 14.4 - An interesting and practical use of the 2 test...Ch. 14.5 - A study to determine the effectiveness of a drug...Ch. 14.5 - The 2 test used in Exercise 14.22 is equivalent to...Ch. 14.5 - How do Americans in the sandwich generation...Ch. 14.5 - Does education really make a difference in how...Ch. 14.5 - A manufacturer of buttons wished to determine...Ch. 14.5 - Traditionally, U.S. labor unions have been content...Ch. 14.5 - Prob. 29ECh. 14.5 - Refer to Exercise 14.29. Estimate the difference...Ch. 14.5 - A survey was conducted to investigate interest of...Ch. 14 - Prob. 32SECh. 14 - A survey was conducted to determine student,...Ch. 14 - How would you rate yourself as a driver? According...Ch. 14 - Prob. 35SECh. 14 - Knee injuries are a major problem for athletes in...Ch. 14 - It is often not clear whether all properties of a...Ch. 14 - Prob. 39SECh. 14 - Prob. 40SECh. 14 - Prob. 41SECh. 14 - Prob. 42SECh. 14 - Prob. 43SE
Knowledge Booster


Learn more about
Need a deep-dive on the concept behind this application? Look no further. Learn more about this topic, statistics and related others by exploring similar questions and additional content below.Similar questions
- What is meant by the sample space of an experiment?arrow_forwardIn a poll conducted March 17-21, 2005, by the Pew Research Center for the People and the Press, a simple random sample of 1505 American adults were asked whether they were in favor of tighter enforcement of government rules on TV content during hours when children are most likely to be watching. Of the 1505 adults, 1129 responded yes. 1. What proportion of those surveyed were in favor of tighter enforcement of government rules on TV content during hours when children are most likely to be watching? 2. Obtain a 95% confidence interval for the proportion of Americans who are in favor of tighter enforcement of government rules on TV content during hours when children are most likely to be watching. (Round the final answer to four decimal places). P(1-p) CI = ptz 3. Interpret the confidence interval. 4. What proportion of those surveyed were in favor of tighter enforcement of government rules on TV content during hours when children are most likely to be watching when we apply the…arrow_forwardIn a 2018 study, Phoenix Marketing International identified Bridgeport, Connecticut; San Jose, California; Washington, DC; and Lexington Park, Maryland, as the four U.S. cities with the highest percentage of millionaires (Kiplinger website). Consider a sample of data that show the following number of millionaires for samples of individuals from each of the four cities. City Bridgeport, San Jose, Washington, Lexington Park, Millionaire CT CA D.C. MD Yes 44 37 37 32 No 456 263 363 368 a. What is the estimate of the percentage of millionaires in each of these cities (to 1 decimal)? Bridgeport, San Jose, Washington, Lexington Park, CT CA D.C. MD Percentage, % b. Using a = 0.05 level of significance, test for the equality of the population proportion of millionaires for these four cities. What is the p-value? Compute the value of the x test statistic (to 3 decimals). Use Table 3 of Appendix B to find the p-value. The p-value is - Select your answer - What is your conclusion? - Select your…arrow_forward
- Organizations such as J.D. Power and Associates use the proportion of owners likely to repurchase a particular automobile as an indication of customer loyalty for the automobile. An automobile with a greater proportion of owners likely to repurchase is concluded to have greater customer loyalty. A study was conducted to compare the customer loyalty for three automobiles: Chevrolet Impala, Ford Fusion, and Honda Accord. The study contained 500 respondents and the data is summarized in the Microsoft Excel Online file below. Use the spreadsheet to perform the required calculations and hypothesis test.arrow_forwardOne of the theories behind the large polling errors in 2016 election was the "shy Trump voter". According to this explanation, many respondents voted differently than what they told the pollsters. What type of bias does this phenomena introduce to the polls? answer choices 1.Selection bias 2.Response bias 3.Non-response bias 4.Something elsearrow_forwardOne of the most important aspects of a store's image is the perceived quality of its merchandise. Other factors include merchandise pricing, assortment of products, convenience of location, and service. Suppose image perceptions of shoppers of specialty stores and shoppers of discount stores are being compared. A random sample of shoppers is taken at each type of store, and the shoppers are asked whether the quality of merchandise is a determining factor in their perception of the store's image. Some 75% of the 320 shoppers at the specialty stores say yes, but only 52% of the 420 shoppers at the discount store say yes. Use these data to test to determine if there is a significant difference between the proportion of shoppers at specialty stores and the proportion of shoppers at discount stores who say that quality of merchandise is a determining factor in their perception of a store's image. Let alpha equal.10. Appendix A Statistical Tables (Round the intermediate values to 3 decimal…arrow_forward
- A Deloitte employment survey asked a sample of human resource executives how their company planned to change its workforce over the next 12 months. A categorical response variable showed three options: The company plans to hire and add to the number of employees, the company plans no change in the number of employees, or the company plans to lay off and reduce the number of employees. Another categorical variable indicated if the company was private or public. Sample data for 171 companies are summarized as follows.arrow_forwardA social scientist wanted to study the education levels of adults who live in the tristate area of southwestern Pennsylvania, the West Virginia panhandle, and southeastern Ohio. A random sample of 25 middle-aged adults from each region was selected and asked about their highest level of education. The responses are displayed in the table. The scientist would like to know if these data provide convincing evidence that the distribution of education differs for these regions in the population of all tristate residents. What is the appropriate inference procedure? chi-square test for goodness of fit because the data come from one random sample chi-square test for homogeneity because the data come from independent random samples chi-square test for association/independence because the data come from one random sample chi-square test for association/independence because the data come from independent random samplesarrow_forwardA Deloitte employment survey asked a sample of human resource executives how their company planned to change its workforce over the next 12 months. A categorical response variable showed three options: the company plans to hire and add to the number of employees, the company plans no change in the number of employees, or the company plans to lay off and reduce the number of employees. Another categorical variable indicated if the company was private or public. Sample data for 180 companies are summarized as follows. Employment Plan Company Private Public Add Employees 37 32 No Change 19 34 Lay Off Employees 16 42 1) Conduct a test of independence to determine if the employment plan for the next 12 months is independent of the type of company. State the null and alternative hypotheses. A) H0: Employment plan is not mutually exclusive from the type of company. Ha: Employment plan is mutually exclusive from the type of company. B) H0: Employment plan is not independent of…arrow_forward
arrow_back_ios
arrow_forward_ios
Recommended textbooks for you
 Glencoe Algebra 1, Student Edition, 9780079039897...AlgebraISBN:9780079039897Author:CarterPublisher:McGraw Hill
 Holt Mcdougal Larson Pre-algebra: Student Edition...AlgebraISBN:9780547587776Author:HOLT MCDOUGALPublisher:HOLT MCDOUGAL
 College Algebra (MindTap Course List)AlgebraISBN:9781305652231Author:R. David Gustafson, Jeff HughesPublisher:Cengage Learning
 Big Ideas Math A Bridge To Success Algebra 1: Stu...AlgebraISBN:9781680331141Author:HOUGHTON MIFFLIN HARCOURTPublisher:Houghton Mifflin Harcourt
Glencoe Algebra 1, Student Edition, 9780079039897...
Algebra
ISBN:9780079039897
Author:Carter
Publisher:McGraw Hill
Holt Mcdougal Larson Pre-algebra: Student Edition...
Algebra
ISBN:9780547587776
Author:HOLT MCDOUGAL
Publisher:HOLT MCDOUGAL
College Algebra (MindTap Course List)
Algebra
ISBN:9781305652231
Author:R. David Gustafson, Jeff Hughes
Publisher:Cengage Learning
Big Ideas Math A Bridge To Success Algebra 1: Stu...
Algebra
ISBN:9781680331141
Author:HOUGHTON MIFFLIN HARCOURT
Publisher:Houghton Mifflin Harcourt
Probability & Statistics (28 of 62) Basic Definitions and Symbols Summarized; Author: Michel van Biezen;https://www.youtube.com/watch?v=21V9WBJLAL8;License: Standard YouTube License, CC-BY
Introduction to Probability, Basic Overview - Sample Space, & Tree Diagrams; Author: The Organic Chemistry Tutor;https://www.youtube.com/watch?v=SkidyDQuupA;License: Standard YouTube License, CC-BY