
Concept explainers
Videos
Refer to Exercise 14.36.
- a. Are the computational formulas for obtaining the sum of squares appropriate for the data in the tomato experiment? Justify your answer.
- b. Verify that there are no major violations in the conditions necessary to conduct the F tests in the AOV table.
- c. Write a linear model for this experiment, and estimate all the terms in your model using the data in Exercise 14.36.
14.36 A horticulturalist at a large research institution designs a study to evaluate the effect on tomato yields of water loss due to transpiration. She decides to examine four levels of shading of the tomato plants at three stages of the tomato plant’s development. The four levels of shading (0, 25%, 50%, and 75%) were selected to reduce the solar exposure of the plants. The shading remained in place for 20 days during the early, middle, and late phases of the tomato plants’ growth. There were four plots of tomatoes randomly assigned to each of the combinations of shading and growth stage. At the end of the study, the yields per plot in pounds were recorded. However, due to a problem in the harvesting of the tomatoes, a few of the plot yields were not recorded.
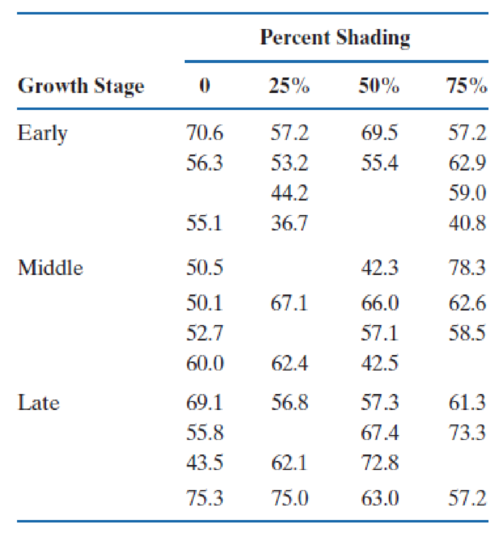
- a. Identify the design for this experiment.
- b. Construct an AOV table for the experiment, and test for the main effects of shading and growth stage and an interaction between shading and growth stage.
- c. Is there a linear trend in the mean yields across the levels of percent shading?
- d. Which level of shading would you recommend for maximum yield?
- e. During which growth stage would you apply the shading?
Want to see the full answer?
Check out a sample textbook solution
Chapter 14 Solutions
An Introduction to Statistical Methods and Data Analysis


- There is some evidence that, in the years−198185, a simple name change resulted in a short-term increase in the price of certain business firms' stocks (relative to the prices of similar stocks). (See D. Horsky and P. Swyngedouw, "Does it pay to change your company's name? A stock market perspective," Marketing Science v. 6, pp.−32035,1987.) Suppose that, to test the profitability of name changes in the more recent market (the past five years), we analyze the stock prices of a large sample of corporations shortly after they changed names, and we find that the mean relative increase in stock price was about 0.86 %, with a standard deviation of 0.10%. Suppose that this mean and standard deviation apply to the population of all companies that changed names during the past five years. Complete the following statements about the distribution of relative increases in stock price for all companies that changed names during the past five years. According to Chebyshev's theorem, at least 84%…arrow_forwardThere is some evidence that, in the years −198185 , a simple name change resulted in a short-term increase in the price of certain business firms' stocks (relative to the prices of similar stocks). (See D. Horsky and P. Swyngedouw, "Does it pay to change your company's name? A stock market perspective," Marketing Science v. 6 , pp. −32035,1987 .) Suppose that, to test the profitability of name changes in the more recent market (the past five years), we analyze the stock prices of a large sample of corporations shortly after they changed names, and we find that the mean relative increase in stock price was about 0.89 %, with a standard deviation of 0.16 %. Suppose that this mean and standard deviation apply to the population of all companies that changed names during the past five years. Complete the following statements about the distribution of relative increases in stock price for all companies that changed names during the past five years. (a)…arrow_forwardThere is some evidence that, in the years−198185, a simple name change resulted in a short-term increase in the price of certain business firms' stocks (relative to the prices of similar stocks). (See D. Horsky and P. Swyngedouw, "Does it pay to change your company's name? A stock market perspective," Marketing Sciencev. 6, pp.−32035,1987.) Suppose that, to test the profitability of name changes in the more recent market (the past five years), we analyze the stock prices of a large sample of corporations shortly after they changed names, and we find that the mean relative increase in stock price was about 0.82%, with a standard deviation of 0.13%. Suppose that this mean and standard deviation apply to the population of all companies that changed names during the past five years. Complete the following statements about the distribution of relative increases in stock price for all companies that changed names during the past five years. a) According to Chebyshev's theorem, at least 56%…arrow_forward
- Compute the forecasted values for Yt for July and August in 2020 by using the modelsstated in (c) and (d)arrow_forwardThe Boeing Company faces a critical strategic choice in its competition with Airbus Industries for the long-haul flight segment: Should it design and build a super-747 model that can carry 550 passengers at speeds around 350 mph, or a plane that can fly at 95 percent of the speed of sound but carry only about 350 passengers? As a member of Boeing's Planning Group, your task is to build a model to investigate the trade-offs involved in this decision.arrow_forwardThe estimated model was Theft = β0 + β1caught + β2penalty + β3gender + β4Income + β5Edu Provide an explanation of the expected signs of each of the coefficients, referring to relevant economic theory.arrow_forward
- Table 14.17 The Least Squares Point Estimates for Exercise 14.51 Bo = 10.3676 (.3710) B1 = .0500 (<.001) B2 = 6.3218 (.0152) B3 = -11.1032 (.0635) B4 = -.4319 (.0002) Questions Using the t statistic and appropriate critical values, test Ho: βj = 0 versus Ha: βj ≠ 0 by setting α equal to .05. Which independent variables are significantly related to y in the model with α = .05? Using the t statistic and appropriate critical values, test Ho: βj = 0 versus Ha: βj ≠ 0 by setting α equal to .01. Which independent variables are significantly related to y in the model with α = .01? Find the p-value for testing Ho: βj = 0 versus Ha: βj ≠ 0 on the output. Using the p-value, determine whether we can reject Ho by setting α equal to .10, .05, .01, and .001. What do you conclude about the significance of the independent variables in the model? Calculate the 95 percent confidence interval for βj. Discuss one practical application of this interval. Calculate the 99 percent confidence interval for…arrow_forwardFloyd Distributors, Inc., provides a variety of auto parts to small local garages. Floyd purchases parts from manufacturers according to the EOQ model and then ships the parts from a regional warehouse direct to its customers. For a particular type of muffler, Floyd's EOQ analysis recommends orders with Q* = 20 to satisfy an annual demand of 180 mufflers. Floyd's has 250 working days per year, and the lead time averages 15 days.Note: Use Appendix B to identify the areas for the standard normal distribution. What is the reorder point if Floyd assumes a constant demand rate? If required, round your answer up to the nearest whole number. r = fill in the blank 1 Suppose that an analysis of Floyd's muffler demand shows that the lead-time demand follows a normal probability distribution with µ = 12 and σ = 2.2. If Floyd's management can tolerate one stock-out per year, what is the revised reorder point? If required, round your answer up to the nearest whole number. r = fill in the blank…arrow_forward3.4 The system is tested on a sample of one hundred computers and the average connection speed is found to be far below 400 kilobits. What hypothesis should probably be rejected? Explain. If the customer needs a connection speed of 400 kilobits to run her application programs, what is the business decision that corresponds to the decision regarding the hypotheses?arrow_forward
- If the data analyst hypothesizes that grocery sales are higher when payment is made using credit cards compared to cash payment, the null hypothesis would likely state that grocery sales are lower when payment is made using credit cards compared to cash payment. T/Farrow_forwardConsider the following statements: I. Multicollinearity is present when there is a high degree of linear correlation between the residuals. II. A regression analysis between weight (y in pounds) and height (x in inches) resulted in the following least squares line: y-hat = 135 + 6x + errors. This implies that if the height is increased by 1 inch, the weight increases by 6 pounds in this linear model. a. I is true and II is false. b. I is false and II is true. c. Both I and II are true. d. Both I and II are false. e. More information is needed for each statement in order to tell which is true or false.arrow_forward10. For the following data, compute the least squares regression line for predicting gpagiven SAT.SAT: 500 530 590 660 610 700 570 640gpa: 2.3 3.1 2.6 3.0 2.4 3.3 2.6 3.5arrow_forward
 MATLAB: An Introduction with ApplicationsStatisticsISBN:9781119256830Author:Amos GilatPublisher:John Wiley & Sons Inc
 Probability and Statistics for Engineering and th...StatisticsISBN:9781305251809Author:Jay L. DevorePublisher:Cengage Learning
 Statistics for The Behavioral Sciences (MindTap C...StatisticsISBN:9781305504912Author:Frederick J Gravetter, Larry B. WallnauPublisher:Cengage Learning
 Elementary Statistics: Picturing the World (7th E...StatisticsISBN:9780134683416Author:Ron Larson, Betsy FarberPublisher:PEARSON
 The Basic Practice of StatisticsStatisticsISBN:9781319042578Author:David S. Moore, William I. Notz, Michael A. FlignerPublisher:W. H. Freeman
 Introduction to the Practice of StatisticsStatisticsISBN:9781319013387Author:David S. Moore, George P. McCabe, Bruce A. CraigPublisher:W. H. Freeman