
Essentials of Statistics for Business and Economics (with XLSTAT Printed Access Card)
8th Edition
ISBN: 9781337114172
Author: David R. Anderson, Dennis J. Sweeney, Thomas A. Williams, Jeffrey D. Camm, James J. Cochran
Publisher: Cengage Learning
expand_more
expand_more
format_list_bulleted
Concept explainers
Videos
Textbook Question
Chapter 14.9, Problem 50E
Consider the following data for two variables, x and y.
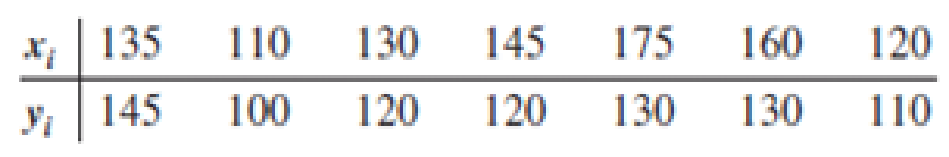
- a. Compute the standardized residuals for these data. Do the data include any outliers? Explain.
- b. Plot the standardized residuals against
- c. Develop a
scatter diagram for these data. Does the scatter diagram indicate any outliers in the data? In general, what implications does this finding have for simple linear regression?
Expert Solution & Answer
Want to see the full answer?
Check out a sample textbook solution
Students have asked these similar questions
Suppose there is a significant correlation between variables. describe 2 instances in which it might be inappropriate to use the linear regression model for prediction
The fish in my pond have mean lenth 14 inches with a standard deviation of 2 inches and mean weight 4 pounds with a standard deviation of .8 pounds. The correlation coefficient of length and weight is .4. If the length of a particular randomly selected fish is reported to be 15 inches, then what should we predict for the weight of that fish using simple linear regression?
The fish in my pond have mean length 10 inches with a standard deviation of 2 inches and mean weight 4 pounds with a standard deviation of .6 pounds. The correlation coefficient of length and weight is .9. If the length of a particular randomly selected fish is reported to be 15 inches, then what should we predict for the weight of that fish using simple linear regression?
Chapter 14 Solutions
Essentials of Statistics for Business and Economics (with XLSTAT Printed Access Card)
Ch. 14.2 - Given are five observations for two variables, x...Ch. 14.2 - Given are five observations for two variables, x...Ch. 14.2 - Given are five observations collected in a...Ch. 14.2 - Retail and Trade: Female Managers. The following...Ch. 14.2 - Production Line Speed and Quality Control. Brawdy...Ch. 14.2 - Prob. 6ECh. 14.2 - Sales Experience and Performance. A sales manager...Ch. 14.2 - Broker Satisfaction. The American Association of...Ch. 14.2 - Estimating Landscaping Expenditures. David’s...Ch. 14.2 - Prob. 10E
Ch. 14.2 - Laptop Ratings. To help consumers in purchasing a...Ch. 14.2 - Prob. 12ECh. 14.2 - Auditing Itemized Tax Deductions. To the Internal...Ch. 14.2 - Distance and Absenteeism. A large city hospital...Ch. 14.3 - 15. The data from exercise 1...Ch. 14.3 - Prob. 16ECh. 14.3 - The data from exercise 3 follow.
The estimated...Ch. 14.3 - Price and Quality of Headphones. The following...Ch. 14.3 - Prob. 19ECh. 14.3 - Price and Weight of Bicycles. Bicycling, the...Ch. 14.3 - Cost Estimation. An important application of...Ch. 14.3 - Prob. 22ECh. 14.5 - The data from exercise 1 follow.
Compute the mean...Ch. 14.5 - The data from exercise 2 follow.
Compute the mean...Ch. 14.5 - The data from exercise 3 follow.
What is the...Ch. 14.5 - Headphones Conclusion. In exercise 18, the data on...Ch. 14.5 - Prob. 27ECh. 14.5 - Broker Satisfaction Conclusion. In exercise 8,...Ch. 14.5 - Cost Estimation Conclusion. Refer to exercise 21,...Ch. 14.5 - Prob. 30ECh. 14.5 - Significance of Racing Bike Weight on Price. In...Ch. 14.6 - The data from exercise 1 follow. xi 1 2 3 4 5 yi 3...Ch. 14.6 - Prob. 33ECh. 14.6 - 34. The data from exercise 3...Ch. 14.6 - Prob. 35ECh. 14.6 - 36. In exercise 7, the data on y = annual sales ($...Ch. 14.6 - In exercise 13, data were given on the adjusted...Ch. 14.6 - Prob. 38ECh. 14.6 - Prob. 39ECh. 14.7 - Apartment Selling Price. The commercial division...Ch. 14.7 - Computer Maintenance. Following is a portion of...Ch. 14.7 - Annual Sales and Salesforce. A regression model...Ch. 14.7 - Prob. 43ECh. 14.7 - Auto Racing Helmet. Automobile racing,...Ch. 14.8 - Given are data for two variables, x and y. a....Ch. 14.8 - Prob. 46ECh. 14.8 - Restaurant Advertising and Revenue. Data on...Ch. 14.8 - Experience and Sales. Refer to exercise 7, where...Ch. 14.8 - Prob. 49ECh. 14.9 - Consider the following data for two variables, x...Ch. 14.9 - Consider the following data for two variables, x...Ch. 14.9 - Predicting Charity Expenses. Charity Navigator is...Ch. 14.9 - Prob. 53ECh. 14.9 - Valuation of a Major League Baseball Team. The...Ch. 14 - 55. Does a high value of r2 imply that two...Ch. 14 - Prob. 56SECh. 14 - What is the purpose of testing whether 1 = 0? If...Ch. 14 - The Dow Jones Industrial Average (DJIA) and the...Ch. 14 - Prob. 59SECh. 14 - Prob. 60SECh. 14 - Machine Maintenance. Jensen Tire & Auto is in the...Ch. 14 - Production Rate and Quality Control. In a...Ch. 14 - Absenteeism and Location. A sociologist was hired...Ch. 14 - Bus Maintenance. The regional transit authority...Ch. 14 - Studying and Grades. A marketing professor at...Ch. 14 - Income and Percent Audited. The Transactional...Ch. 14 - Used Car Mileage and Price. The Toyota Camry is...Ch. 14 - One measure of the risk or volatility of an...Ch. 14 - As part of a study on transportation safety, the...Ch. 14 - Consumer Reports tested 166 different...Ch. 14 - When trying to decide what car to buy, real value...Ch. 14 - Buckeye Creek Amusement Park is open from the...
Knowledge Booster


Learn more about
Need a deep-dive on the concept behind this application? Look no further. Learn more about this topic, statistics and related others by exploring similar questions and additional content below.Similar questions
- There exists a moderate relationship between the variables x and y.if we draw samples of increasing sample size,what can we expect from the sample r value,the regression slope and the p value of the regression or correlation be affected by increasing sample sizearrow_forwardFor the population of Jellystone bears, the mean weight is 600 pounds and the mean blood pressure is 150, and the SLR regression slope for predicting blood pressure using weight has been found to be 0.3. Let us accept that a live bear cannot have negative blood pressure. What is the minimum weight in pounds for live bears in Jellystone Park?arrow_forwardA researcher examined the relationship between the annual tax amount paid by the construction company owners and the total expense items spent for the construction with regression analysis and calculated the regression line estimation as Y=6+2X. According to this; Write the interpretations of the cutoff and regression parameters, respectively, in your OWN SENTENCES in a statistically appropriate way over the tax amount and expenses.arrow_forward
- suppose that you want to conduct a study on the relationship between women's shoe sizes and their height, and you have collected samples of female undergraduates at your university. The mean height of women in your sample is 64 inches, with a standard deviation of 2 inches. The mean shoe size is 8, with a standard deviation of 1. The correlation between the shoe size and height in your sample is .05. What is the least squares estimate of the slope parameter in your regression model?arrow_forwardWould someone familiar with SPSS be able to help me complete the table and the questions? (a) Explain which of the variables have statistically significant effects at the α = 0.05 level. (b) Are the conclusions different to the results obtained by univariate regression? Explain why and which approach is likely to be preferable?arrow_forwardThe same media consultants decided to continue their investigation of the focal relationship between income and TV viewing habits. In order to confirm the existence of the focal relationship, they decided to control for immigration status by adding a variable measuring the number of each survey respondent's grandparents who were born outside the U.S. The researchers wonder if immigration background could influence both income and TV watching (but they hope this is not true, because it could invalidate the focal relationship). The researchers conduct a multivariate regression by adding a measure of number of grandparents born outside the U.S. to the regression equation presented in Equation 1 of Table 1. The results of the second regression equation are presented in Equation 2 of Table 1. ]]Table 1. OLS Regression Coefficients Representing Influence of Income and Control Variables on Number of Hours of TV Watched per Day Equation 1 Equation 2 Equation 3 Annual…arrow_forward
- The same media consultants decided to continue their investigation of the focal relationship between income and TV viewing habits. In order to confirm the existence of the focal relationship, they decided to control for immigration status by adding a variable measuring the number of each survey respondent's grandparents who were born outside the U.S. The researchers wonder if immigration background could influence both income and TV watching (but they hope this is not true, because it could invalidate the focal relationship). The researchers conduct a multivariate regression by adding a measure of number of grandparents born outside the U.S. to the regression equation presented in Equation 1 of Table 1. The results of the second regression equation are presented in Equation 2 of Table 1. Table 1. OLS Regression Coefficients Representing Influence of Income and Control Variables on Number of Hours of TV Watched per Day Equation 1 Equation 2 Equation 3 Annual Income…arrow_forwardThe same media consultants decided to continue their investigation of the focal relationship between income and TV viewing habits. In order to confirm the existence of the focal relationship, they decided to control for immigration status by adding a variable measuring the number of each survey respondent's grandparents who were born outside the U.S. The researchers wonder if immigration background could influence both income and TV watching (but they hope this is not true, because it could invalidate the focal relationship). The researchers conduct a multivariate regression by adding a measure of number of grandparents born outside the U.S. to the regression equation presented in Equation 2 of Table 1. The results of the second regression equation are presented in Equation 2 of Table 1. Table 1. OLS Regression Coefficients Representing Influence of Income and Control Variables on Number of Hours of TV Watched per Day Equation 1 Equation 2 Equation 3 Annual Income…arrow_forwardIdentify two different conditions under which the regression line should not be used to make predictions.arrow_forward
- how to plot the estimated regression line on the scatter diagram in letter c and how to solve for letter d with grapharrow_forwardfind the (a) explained variation, (b) unexplained variation, and (c) indicated prediction interval. In each case, there is sujficient evidence to support a claim of a linear correlation, so it is reasonable to use the regression equation when making predictions. Altitude and Temperature Listed below are altitudes (thousands of feet) and outside air temperatures (°F) recorded by the author during Delta Flight 1053 from New Orleans to Atlanta. For the prediction interval, use a 95% confidence level with the altitude of 6327 ft (or 6.327 thousand feet).arrow_forwardRemove the outlier and compute the least-square regression line for predicting the president's age from the first lady's age. Round the slope and y-intercept values to at least four decimal places.arrow_forward
arrow_back_ios
SEE MORE QUESTIONS
arrow_forward_ios
Recommended textbooks for you
 MATLAB: An Introduction with ApplicationsStatisticsISBN:9781119256830Author:Amos GilatPublisher:John Wiley & Sons Inc
 Probability and Statistics for Engineering and th...StatisticsISBN:9781305251809Author:Jay L. DevorePublisher:Cengage Learning
 Statistics for The Behavioral Sciences (MindTap C...StatisticsISBN:9781305504912Author:Frederick J Gravetter, Larry B. WallnauPublisher:Cengage Learning
 Elementary Statistics: Picturing the World (7th E...StatisticsISBN:9780134683416Author:Ron Larson, Betsy FarberPublisher:PEARSON
 The Basic Practice of StatisticsStatisticsISBN:9781319042578Author:David S. Moore, William I. Notz, Michael A. FlignerPublisher:W. H. Freeman
 Introduction to the Practice of StatisticsStatisticsISBN:9781319013387Author:David S. Moore, George P. McCabe, Bruce A. CraigPublisher:W. H. Freeman
MATLAB: An Introduction with Applications
Statistics
ISBN:9781119256830
Author:Amos Gilat
Publisher:John Wiley & Sons Inc
Probability and Statistics for Engineering and th...
Statistics
ISBN:9781305251809
Author:Jay L. Devore
Publisher:Cengage Learning
Statistics for The Behavioral Sciences (MindTap C...
Statistics
ISBN:9781305504912
Author:Frederick J Gravetter, Larry B. Wallnau
Publisher:Cengage Learning
Elementary Statistics: Picturing the World (7th E...
Statistics
ISBN:9780134683416
Author:Ron Larson, Betsy Farber
Publisher:PEARSON
The Basic Practice of Statistics
Statistics
ISBN:9781319042578
Author:David S. Moore, William I. Notz, Michael A. Fligner
Publisher:W. H. Freeman
Introduction to the Practice of Statistics
Statistics
ISBN:9781319013387
Author:David S. Moore, George P. McCabe, Bruce A. Craig
Publisher:W. H. Freeman
Correlation Vs Regression: Difference Between them with definition & Comparison Chart; Author: Key Differences;https://www.youtube.com/watch?v=Ou2QGSJVd0U;License: Standard YouTube License, CC-BY
Correlation and Regression: Concepts with Illustrative examples; Author: LEARN & APPLY : Lean and Six Sigma;https://www.youtube.com/watch?v=xTpHD5WLuoA;License: Standard YouTube License, CC-BY