
Concept explainers
Videos
a.
To find:The shape of the distribution.
a.
Answer to Problem 1.33E
The shape of the distribution is symmetric.
Explanation of Solution
Given information: The data is shown below.
| Washington | 67 | Arthur | 56 |
| J. Adams | 90 | Cleveland | 71 |
| Jefferson | 83 | B.Harrison | 67 |
| Madison | 85 | McKinley | 58 |
| Monroe | 73 | T.Roosevelt | 60 |
| J.0.Adams | 80 | Taft | 72 |
| Jackson | 78 | Wilson | 67 |
| Van Buren | 79 | Harding | 57 |
| W.H.Harrison | 68 | Coolidge | 60 |
| Tyler | 71 | Hoover | 90 |
| Polk | 53 | F.D.Roosevelt | 63 |
| Taylor | 65 | Truman | 88 |
| Fillmore | 74 | Eisenhower | 78 |
| Pierce | 64 | Kennedy | 46 |
| Buchanan | 77 | L. Johnson | 64 |
| Lincoln | 56 | Nixon | 81 |
| A. Johnson | 66 | Ford | 93 |
| Grant | 63 | Carter | 93 |
| Hayes | 70 | Reagan | 93 |
| Garfield | 49 |
Calculation:
The distribution is consisting of the ages at death per the presidents and the data is looking like symmetric.
Thus, the shape of the distribution is symmetric.
b.
To find: The stem and leaf plot for the data.
The stem and leaf plot for the data is shown in Figure-1.
b.
Answer to Problem 1.33E
The stem and leaf plot for the data is shown in Figure-1.
Explanation of Solution
Given information: The data is shown below.
| Washington | 67 | Arthur | 56 |
| J. Adams | 90 | Cleveland | 71 |
| Jefferson | 83 | B.Harrison | 67 |
| Madison | 85 | McKinley | 58 |
| Monroe | 73 | T.Roosevelt | 60 |
| J.0.Adams | 80 | Taft | 72 |
| Jackson | 78 | Wilson | 67 |
| Van Buren | 79 | Harding | 57 |
| W.H.Harrison | 68 | Coolidge | 60 |
| Tyler | 71 | Hoover | 90 |
| Polk | 53 | F.D.Roosevelt | 63 |
| Taylor | 65 | Truman | 88 |
| Fillmore | 74 | Eisenhower | 78 |
| Pierce | 64 | Kennedy | 46 |
| Buchanan | 77 | L. Johnson | 64 |
| Lincoln | 56 | Nixon | 81 |
| A. Johnson | 66 | Ford | 93 |
| Grant | 63 | Carter | 93 |
| Hayes | 70 | Reagan | 93 |
| Garfield | 49 |
Calculation:
The stem and leaf plot is shown below.
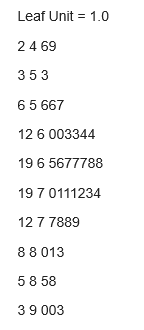
Figure-1
Thus, the stem and leaf plot for the data is shown in Figure-1.
c.
To explain:The five youngest presidents at time of death appear in lower tail.
c.
Explanation of Solution
Given information: The data is shown below.
| Washington | 67 | Arthur | 56 |
| J. Adams | 90 | Cleveland | 71 |
| Jefferson | 83 | B.Harrison | 67 |
| Madison | 85 | McKinley | 58 |
| Monroe | 73 | T.Roosevelt | 60 |
| J.0.Adams | 80 | Taft | 72 |
| Jackson | 78 | Wilson | 67 |
| Van Buren | 79 | Harding | 57 |
| W.H.Harrison | 68 | Coolidge | 60 |
| Tyler | 71 | Hoover | 90 |
| Polk | 53 | F.D.Roosevelt | 63 |
| Taylor | 65 | Truman | 88 |
| Fillmore | 74 | Eisenhower | 78 |
| Pierce | 64 | Kennedy | 46 |
| Buchanan | 77 | L. Johnson | 64 |
| Lincoln | 56 | Nixon | 81 |
| A. Johnson | 66 | Ford | 93 |
| Grant | 63 | Carter | 93 |
| Hayes | 70 | Reagan | 93 |
| Garfield | 49 |
From Figure-1 it is clear that The five youngest presidents at time of death appear in lower tail are Kennedy at age of 46, Garfield at age of 49, Polk at age of 53, Arthur at age of 56 and Lincoln at age of 56.
Want to see more full solutions like this?
Chapter 1 Solutions
EBK INTRODUCTION TO PROBABILITY AND STA


 Glencoe Algebra 1, Student Edition, 9780079039897...AlgebraISBN:9780079039897Author:CarterPublisher:McGraw Hill
 Holt Mcdougal Larson Pre-algebra: Student Edition...AlgebraISBN:9780547587776Author:HOLT MCDOUGALPublisher:HOLT MCDOUGAL
 Big Ideas Math A Bridge To Success Algebra 1: Stu...AlgebraISBN:9781680331141Author:HOUGHTON MIFFLIN HARCOURTPublisher:Houghton Mifflin Harcourt