
Concept explainers
Videos
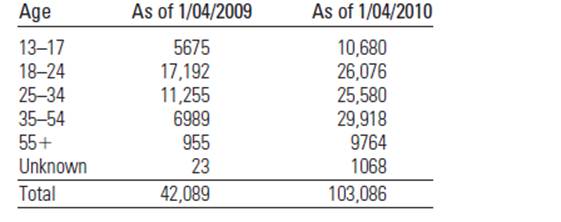
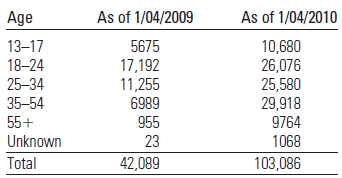
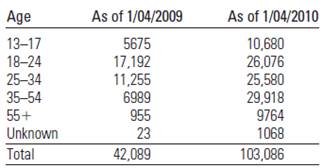
Facebook Fanatics The social networking site called Facebook has grown quickly since its inception in 2004. In fact, Facebook’s United States user base grew from 42 million users to 103 million users between 2009 and 2010. The table below shows the age distribution of Facebook users (in thousands) as it changed from January 2009 to January 2010.3
a. Define the variable that has been measured in this table.
b. Is the variable quantitative or qualitative?
c. What do the numbers represent?
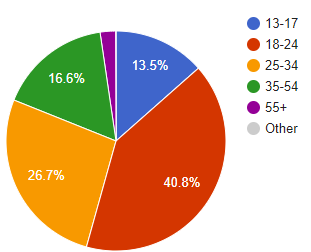
d. Construct a pie chart to describe the age distribution of Facebook users as of January 4, 2009.
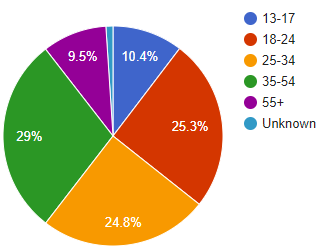
e. Construct a pie chart to describe the age distribution of Facebook users as of January 4, 2010.
f. Refer to parts d and e. How would you describe the changes in the age distributions of Facebook users during this 1-year period?
a.
Todefine: thevariable that has been measured in the table.
Explanation of Solution
Given:
The given table below shows that the age distribution of Facebook users as it changes from January 2009 to January 2010:

Concept used:
The variables are the topic that were investigated.
Categorical/quantitative variables place the industry into a category while a quantitative variable is a numerical variable.
Calculation:
The table shows the age distributions of Facebook users and thus the variable that has been measuring the age.
b.
To check: whether that it is quantitative and qualitative.
Answer to Problem 1.14E
Qualitative.
Explanation of Solution
Given:
The given table below shows that the age distribution of Facebook users as it changes from January 2009 to January 2010:

Concept used:
The variables are the topic that were investigated.
Categorical/quantitative variables place the industry into a category while a quantitative variable is a numerical variable.
Calculation:
In the table, it is noted that the place of the people in different age group
c.
To find: that the number represent.
Explanation of Solution
Given:
The given table below shows that the age distribution of Facebook users as it changes from January 2009 to January 2010:
Calculation:
The numbers in the table above represents the number of Facebook user that fall within the corresponding age category.
d.
To construct: a pie chart to describe the age distribution of Facebook user in
Explanation of Solution
Given:
The given table below shows that the age distribution of Facebook users as it changes from January 2009 to January 2010:
Calculation:
The percentage is the frequency divided by the total frequency. Note that the table describes a total of
| Category | Frequency | Percent |
| Unknown |
The slice (central angle) is the product
| Category | Frequency | Percent | Slice size |
| Unknown |
Draw a circle for each category using the determined slice size.
January 2009
e.
To construct: a pie chart to describe the age distribution of Facebook user in
Explanation of Solution
Given:
The given table below shows that the age distribution of Facebook users as it changes from January 2009 to January 2010:

Calculation:
The percentage is the frequency divided by the total frequency. Note that the table describes a total of
| Category | Frequency | Percent |
| Unknown |
The slice (central angle) is the product
| Category | Frequency | Percent | Slice size |
| Unknown |
Draw a circle for each category using the determined slice size.
January 2010
f.
To describe: the changes in the age distribution of Facebook users in 1-year period in part (d) and part (e).
Explanation of Solution
Given:
The given table below shows that the age distribution of Facebook users as it changes from January 2009 to January 2010:

Calculation:
It appears that a lot of older people signed up as Facebook user between 2009 to 2010, because the percentage of first three categories are larger in 2009 compared to 2010, while the other age categories contain a smaller percentage in 2009 compared to 2010.
The largest decrease in percentage occurred in the 18-24 age category, while the largest increase in percentage occurred in the 35-54 age category.
Want to see more full solutions like this?
Chapter 1 Solutions
EBK INTRODUCTION TO PROBABILITY AND STA


 Linear Algebra: A Modern IntroductionAlgebraISBN:9781285463247Author:David PoolePublisher:Cengage Learning
 Glencoe Algebra 1, Student Edition, 9780079039897...AlgebraISBN:9780079039897Author:CarterPublisher:McGraw Hill
 Holt Mcdougal Larson Pre-algebra: Student Edition...AlgebraISBN:9780547587776Author:HOLT MCDOUGALPublisher:HOLT MCDOUGAL
 Big Ideas Math A Bridge To Success Algebra 1: Stu...AlgebraISBN:9781680331141Author:HOUGHTON MIFFLIN HARCOURTPublisher:Houghton Mifflin Harcourt
 Algebra: Structure And Method, Book 1AlgebraISBN:9780395977224Author:Richard G. Brown, Mary P. Dolciani, Robert H. Sorgenfrey, William L. ColePublisher:McDougal Littell