
Concept explainers
Videos
A driver’s age has something to do with his or her chance of getting into a fatal car crash. The bar graph shows the number of fatal vehicle crashes per 100 million mules driven for drivers of various age groups, For example. 25-year-old drivers are involved in 4.1 fatal crashes per 100 million miles driven. Thus, when a group of 25-year-old Americans have driven a total of 100 million miles. approximately 4 have been in accidents in which someone died.
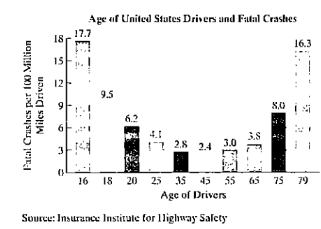
The number of fatal vehicle crashes per 100 miles. N, for drivers of age x can be modeled by the formula
N – 0.013x2 – 1.19x + 28.24.
Use the formula to solve Exercises 135–136.
What age groups are expected to be involved in 3 fatal crashes per 100 million miles driven? How well does the formula model the trend in the actual data shown in the bar graph?
Want to see the full answer?
Check out a sample textbook solution
Chapter 1 Solutions
EP COLLEGE ALG.MYLAB W/ETEXT -W/ACCESS


 Glencoe Algebra 1, Student Edition, 9780079039897...AlgebraISBN:9780079039897Author:CarterPublisher:McGraw Hill
 Holt Mcdougal Larson Pre-algebra: Student Edition...AlgebraISBN:9780547587776Author:HOLT MCDOUGALPublisher:HOLT MCDOUGAL
 Algebra & Trigonometry with Analytic GeometryAlgebraISBN:9781133382119Author:SwokowskiPublisher:Cengage