
Concept explainers
Videos
(a)
Interpretation:
The IR spectrum of the given compound is to be sketched with the X-axis range from
Concept introduction:
IR spectroscopy enables to identify different
One of the greatest advantages of IR spectroscopy is that the frequency of a particular type of vibration is typically found within a characteristic range of frequencies, regardless of the functional group with which the vibration is associated. The fact that absorptions by certain vibrations appear with characteristic frequency ranges enables us to use IR spectroscopy to obtain structural information about a molecule. Stretching vibrations of
Answer to Problem 15.56P
The IR spectrum of the given molecule can be sketched as follows:

Explanation of Solution
The given molecule is
The given molecule has a ketone and alcohol as functional groups. According to Table 15-2, the characteristic frequency of absorption of alcohols
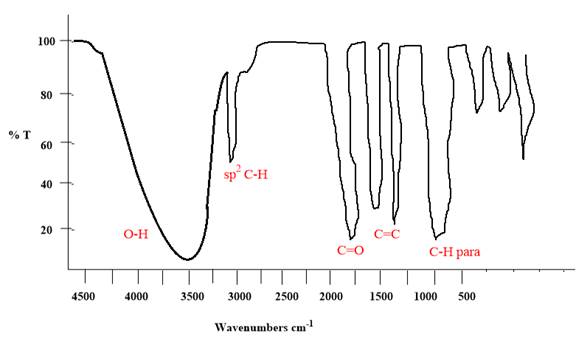
Each significant peak is assigned in the above IR spectrum.
The absorptions by certain vibrations appear with characteristic frequency ranges, enabling us to use IR spectroscopy to obtain structural information about a molecule.
(b)
Interpretation:
The IR spectrum of the given compound is to be sketched with the X-axis range from
Concept introduction:
IR spectroscopy enables to identify different functional groups in the given molecule.
One of the greatest advantages of IR spectroscopy is that the frequency of a particular type of vibration is typically found within a characteristic range of frequencies, regardless of the functional group with which the vibration is associated. The fact that absorptions by certain vibrations appear with characteristic frequency ranges enables us to use IR spectroscopy to obtain structural information about a molecule. Stretching vibrations of
Answer to Problem 15.56P
The IR spectrum of the given molecule can be sketched as follows:

Explanation of Solution
The given molecule is
The given molecule has an
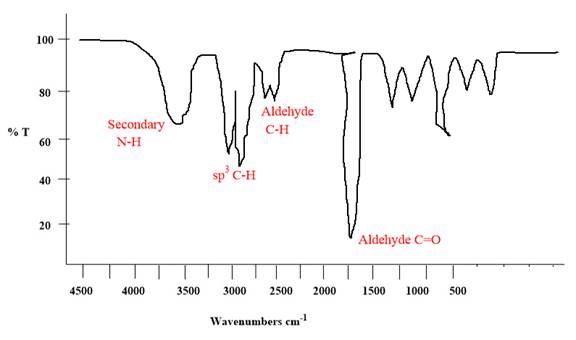
Each significant peak is assigned in the above IR spectrum.
The absorptions by certain vibrations appear with characteristic frequency ranges, enabling us to use IR spectroscopy to obtain structural information about a molecule.
(c)
Interpretation:
The IR spectrum of the given compound is to be sketched with the X-axis range from
Concept introduction:
IR spectroscopy enables to identify different functional groups in the given molecule.
One of the greatest advantages of IR spectroscopy is that the frequency of a particular type of vibration is typically found within a characteristic range of frequencies, regardless of the functional group with which the vibration is associated. The fact that absorptions by certain vibrations appear with characteristic frequency ranges enables us to use IR spectroscopy to obtain structural information about a molecule. Stretching vibrations of
Answer to Problem 15.56P
The IR spectrum of the given molecule can be sketched as follows:
Explanation of Solution
The given molecule is
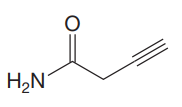
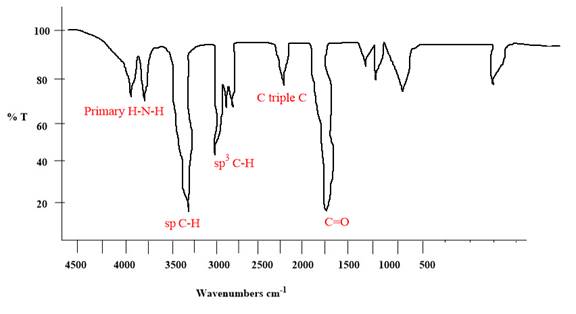
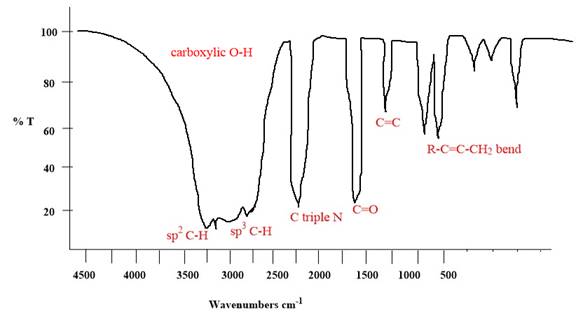
The given molecule has an alkyne and a primary amide as functional groups. According to Table 15-2, the characteristic frequency of absorption of amides
Each significant peak is assigned in the above IR spectrum.
The absorptions by certain vibrations appear with characteristic frequency ranges, enabling us to use IR spectroscopy to obtain structural information about a molecule.
(d)
Interpretation:
The IR spectrum of the given compound is to be sketched with the X-axis range from
Concept introduction:
IR spectroscopy enables to identify different functional groups in the given molecule.
One of the greatest advantages of IR spectroscopy is that the frequency of a particular type of vibration is typically found within a characteristic range of frequencies, regardless of the functional group with which the vibration is associated. The fact that absorptions by certain vibrations appear with characteristic frequency ranges enables us to use IR spectroscopy to obtain structural information about a molecule. Stretching vibrations of
Answer to Problem 15.56P
The IR spectrum of the given molecule can be sketched as follows:
Explanation of Solution
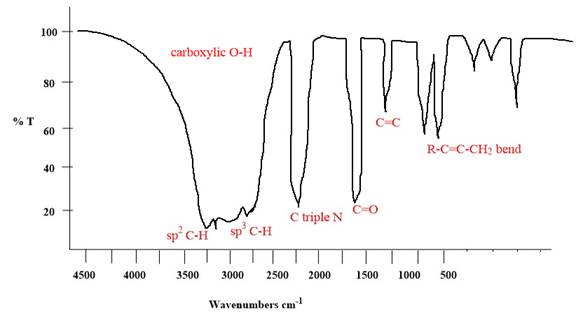
The given molecule is
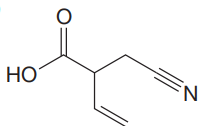
The given molecule has
According to Table 15-2, the characteristic frequency of absorption of
Each significant peak is assigned in the above IR spectrum.
The absorptions by certain vibrations appear with characteristic frequency ranges, enabling us to use IR spectroscopy to obtain structural information about a molecule.
Want to see more full solutions like this?
Chapter 15 Solutions
EBK GET READY FOR ORGANIC CHEMISTRY


- 9) What would be the difference between the 4 alcohols in IR? They all show O-H, C-H sp3, and C-H aromatic bonds. The only way to tell which one is used would be by comparing the fingerprint regions to published IR spectra of each alcohol. Alcohol 2 has an aldehyde C-H group that could be seen between 2700-2800 and 2800-2900 cm-1 Only alcohol 3 will show O-H bond around 3300 cm-1 Only alcohol 1 will show C=C aromatic bonds around 1600 cm-1 10) Assuming 5.0 mL of alcohol 2 was used and 2.2 g of the product was isolated, what is the percent yield for this reaction? The product has a molar mass of 198.00 g/mol. 11) How could the percent yield be increased for this reaction? Add NaOH to neutralize the product as it forms Add a catalyst such as H2SO4 to help speed up the reaction Add a catalyst such as HCl to help speed up the reaction Cool the reaction on ice to increase the rate of reaction 12) Is there another way that the product of this reaction…arrow_forward3. Find the position of the absorption peak of a low-resolution spectrum of 12C180arrow_forward6) The compound with the molecular formula C4H10O was synthesized. It was further analyzed using IR spectroscopy. The spectrum of the compound is illustrated below. Identify the structure of a compound. Justify your answer. Identify as many peaks on its IR spectrum as possible. (5 points) 100 80 60 60 %T 40 20 20 0 4000 R2020-93124TM 3000 2000 1500 1000 400 Wavenumber [cm-1]arrow_forward
- Which column gives greater resolution between compound X and compound Y? Explain your answer.arrow_forward2) From here, the student wants to narrow down Unknown 1 and 2 even further. Fill in the table below to help identify the unknowns. Note: By visual inspection, Unknown 1 is a yellow solid and Unknown 2 is a white color. Compound Absorbance Frequency Absorbance Wavelength Absorbed Color Fluorene 300 nm Ultraviolet 7.14x10¹⁴ s-l 8.33x10¹⁴ s- 7.5x10¹⁴ s-l Fluorenone Fluorenol Ultraviolet 4-Nitrophenol Coumarin 280 nm a) Based on the table above and what you learned in Q1 what is the identity of Unknown 1? b) Based on the table above and what you learned in Q1 what is the identity of Unknown 2?arrow_forward2) The IR spectrum below is of one of the compounds shown. Circle structure that corresponds to the spectrum and label the peaks you used to make your choice. 1-Phenyloctane Ethyl acetate Transmittance (%) 4000 3000 1-methyl-cyclohexene 2000 1500 Wavenumber (cm-¹) 2,3-dimethyl-hexane 1000 500arrow_forward
- Examine the IR spectrum in Photo 1. Record the wavenumber for each relevant peak in Data Table 1. Record the bond represented by each relevant peak. Identify the functional groups associated with each bond and record it. Circle the structure(s) on Photo 2 that match the data.arrow_forwardCH3 c=C H3C H.arrow_forwardQUESTION 1 The IR spectrum below belongs to an organic compound A having one nitrogen atom. Determine which structures that fits to the IR spectrum. Justify your answer by providing two (2) IR absorption peaks with their wavenumber. CN `NH2 Ahserbance /% 50- 100- 2000 Wavenumberrs/ cm 4000 3000 2F00 1F00 1000 F00arrow_forward
- A mass spectrum shows significant peaks at m>z = 87, 115, 140, and 143. Which of the following compounds is responsible for that mass spectrum?arrow_forwardAnalyze the 1H NMR of 2-phenyl-2-propanol. Based on intensities and splitting patterns, it should be possible to assign all of the peaks in this spectrum. Analyze the 1H NMR of 2-cyclohexyl-2-propanol. In this case, it is not possible to assign all peaks. Indicate which peaks can be assigned to specific H atoms in this compound.arrow_forwardA common lab experiment is the dehydration of cyclohexanol to cyclohexene. Explain how you could tell from the IR spectrum whether your product was pure cyclohexene, pure cyclohexanol or a mixture of both. Give approximate frequencies for distinctive peaks.arrow_forward
 Organic Chemistry: A Guided InquiryChemistryISBN:9780618974122Author:Andrei StraumanisPublisher:Cengage Learning