Horngren's Financial & Managerial Accounting, The Managerial Chapters, Student Value Edition (5th Edition)
5th Edition
ISBN: 9780133851496
Author: Tracie L. Miller-Nobles, Brenda L. Mattison, Ella Mae Matsumura
Publisher: PEARSON
expand_more
expand_more
format_list_bulleted
Videos
Textbook Question
Chapter 15, Problem 15.6SE
Shine's Companies, a home improvement store chain, reported the following summarized figures:
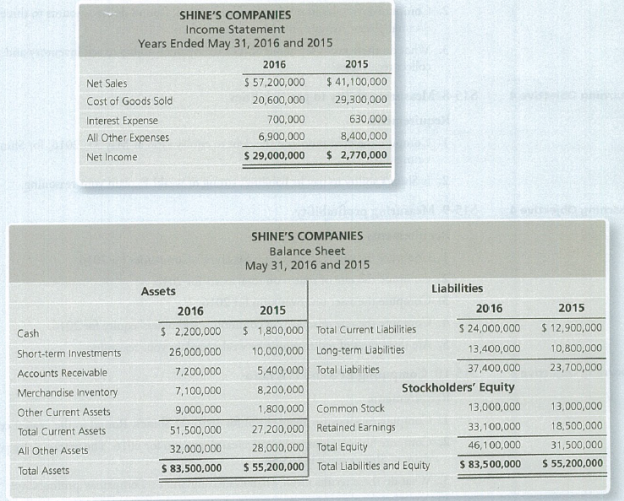
Shine's has 100,000 common shares outstanding during 2016.
Evaluating
Requirements
- 1. Compute Shine’s Companies’ current ratio at May 31, 2016 and 2015.
- 2. Did Shine’s Companies’ current ratio improve, deteriorate, or hold steady during 2016?
Expert Solution & Answer
Want to see the full answer?
Check out a sample textbook solution
Students have asked these similar questions
Win's Companies, a home improvement store chain, reported the following summanzed figures
E (Click the icon to view the income statement.)
E (Click the icon to view the balance sheets.)
Win's has 20,000 common shares outstanding during 2018.
Read the requirements
Requirement 1. Compute Win's Companies' current ratio at May 31, 2018 and 2017
Begin by selecting the formula to calculate Win's Companies' current ratio. Then enter the amounts and calcu ale the current ratio for 2018 and then 2017. (Round your answers to two decimal places, X.XX.)
Current ratio
(i Balance Sheets
Income Statement
Win's Companies
Win's Companies
Balance Sheet
Income Statement
May 31, 2018 and 2017
Years Ended May 31, 2018 and 2017
Assets
Liabilities
2018
2017
2018
2017
2018
2017
Net Sales Revenue
24
57 200 $
39,800
Cash
$.
2.300 $
1300 Total Current Liabilities
22,000 $
12,900
Cost of Goods Sold
22.500
25,500
12,200
11,300
Short-term Invesiments
29 000
13.000 Long-term Liabilities
Interest Expense
500
320…
Use the following information for Short Exercises S15-6 through S15-10.
Accel’s Companies, a home improvement store chain, reported the following summarized figures:
Accel’s has 10,000 common shares outstanding during 2018.
Evaluating current ratio
Requirements
Compute Accel’s Companies’ current ratio at May 31, 2018 and 2017.
Did Accel’s Companies’ current ratio improve, deteriorate, or hold steady during 2018?
The following balances were reported in the financial statements for Ruby Company.
2016 2015
Net Sales $1,650,000 $1,750,000
Net Income 170,000 205,000
Current Assets 410,000 535,000
Current Liabilities 170,000 210,000
Total Liabilities 500,000 675,000
Total Assets 1,550,000 2,450,000
Required:
1. Compute the following ratios for 2016 and 2015 for Ruby Company.
a. Return on sales ratio
b. Current ratio
c. Debt-to-total-assets ratio
Chapter 15 Solutions
Horngren's Financial & Managerial Accounting, The Managerial Chapters, Student Value Edition (5th Edition)
Ch. 15 - What part of the Libertys annual report is written...Ch. 15 - Horizontal analysis of Liberty's balance sheet for...Ch. 15 - Vertical analysis of Liberty's balance sheet for...Ch. 15 - Which statement best describes Liberty's acid-test...Ch. 15 - Liberty's inventory turnover during 2017 was...Ch. 15 - Prob. 6QCCh. 15 - Prob. 7QCCh. 15 - Liberty's rate of return on common stockholders'...Ch. 15 - The company has 2,500 shares of common stock...Ch. 15 - Prob. 10AQC
Ch. 15 - What ate the three main ways to analyze financial...Ch. 15 - What is an annual report? Briefly describe the key...Ch. 15 - Prob. 3RQCh. 15 - What is trend analysis, and how does it differ...Ch. 15 - Prob. 5RQCh. 15 - Prob. 6RQCh. 15 - Prob. 7RQCh. 15 - Briefly describe the ratios that can be used to...Ch. 15 - Prob. 9RQCh. 15 - Briefly describe the ratios that can be used to...Ch. 15 - Briefly describe the ratios that can be used to...Ch. 15 - Prob. 12RQCh. 15 - Prob. 13RQCh. 15 - Prob. 14RQCh. 15 - Prob. 15RQCh. 15 - Prob. 15.1SECh. 15 - Performing horizontal analysis McDonald Corp....Ch. 15 - Calculating trend analysis Variline Corp. reported...Ch. 15 - Performing vertical analysis Hoosier Optical...Ch. 15 - Preparing common-size income statement Data for...Ch. 15 - Shine's Companies, a home improvement store chain,...Ch. 15 - Shine's Companies, a home improvement store chain,...Ch. 15 - Shine's Companies, a home improvement store chain,...Ch. 15 - Prob. 15.9SECh. 15 - Prob. 15.10SECh. 15 - Prob. 15.11SECh. 15 - Using ratios to reconstruct a balance sheet...Ch. 15 - Prob. 15.13SECh. 15 - Prob. 15.14SECh. 15 - Prob. 15.15ECh. 15 - Computing trend analysis Grand Oaks Realty's net...Ch. 15 - Prob. 15.17ECh. 15 - Prob. 15.18ECh. 15 - Prob. 15.19ECh. 15 - Prob. 15.20ECh. 15 - Analyzing the ability to pay liabilities Big Bend...Ch. 15 - Analyzing profitability Varsity, Inc.s comparative...Ch. 15 - Prob. 15.23ECh. 15 - Using ratios to reconstruct a balance sheet The...Ch. 15 - Prob. 15.25ECh. 15 - Computing earnings per share Falconi Academy...Ch. 15 - Prob. 15.27APCh. 15 - Prob. 15.28APCh. 15 - Prob. 15.29APCh. 15 - Prob. 15.30APCh. 15 - Using ratios to evaluate a stock investment...Ch. 15 - Prob. 15.32APCh. 15 - Preparing an income statement The following...Ch. 15 - Computing trend analysis and return on common...Ch. 15 - Prob. 15.35BPCh. 15 - Prob. 15.36BPCh. 15 - Determining the effects of business transactions...Ch. 15 - Prob. 15.38BPCh. 15 - Prob. 15.39BPCh. 15 - Prob. 15.40BPCh. 15 - Prob. 15.41CPCh. 15 - Lance Berkman is the controller of Saturn, a dance...Ch. 15 - Prob. 15.1CTEI
Knowledge Booster


Learn more about
Need a deep-dive on the concept behind this application? Look no further. Learn more about this topic, accounting and related others by exploring similar questions and additional content below.Similar questions
- For fiscal year 2018, Walmart Inc. (WMT) had total revenues of $500.34 billion, net income of $9.86 billion, total assets of $204.52 billion, and total shareholders' equity of $77.87 billion. a. Calculate Walmart's ROE directly, and using the DuPont Identity. b. Comparing with the data for Costco, use the DuPont Identity to understand the difference between the two firms' ROES. Data table For fiscal year 2018, Costco Wholesale Corporation (COST) had a net profit margin of 2.08%, asset turnover of 3.55, and a book equity multiplier of 3.37. Costco's ROE (DuPont) is 24.88%.arrow_forwardThe financial statements for Tyler Toys, Inc. are shown in the popup window: LOADING... . Calculate the profit margin, return on assets, and return on equity for 2013 and 2014 for Tyler Toys. Should any of these ratios or the change in a ratio warrant concern for the managers of Tyler Toys or the shareholders? Tyler Toys, Inc. Income Statement for Years Ending December 31, 2013 and 2014 2014 2013 Revenue $14,146,094 $13,567,551 Cost of goods sold $-8,448,688 $-8,131,338 Selling, general, and administrative expenses $-998,878 $-980,620 Depreciation $-1,497,580 $-1,472,740 EBIT $3,200,948 $2,982,853 Interest expense $-376,634 $-354,060 Taxes $-1,073,239 $-998,941 Net income $1,751,075 $1,629,852 Right-click on the table and select Copy to Clipboard and then right-click the highlighted texts in the popup dialogue box and select Copy in order to paste its…arrow_forwardThe financial statements for Tyler Toys, Inc. are shown in the popup window: LOADING... . Calculate the current ratio, quick ratio, and cash ratio for Tyler Toys for 2013 and 2014. Should any of these ratios or the change in a ratio warrant concern for the managers of Tyler Toys or the shareholders? Tyler Toys, Inc. Income Statement for Years Ending December 31, 2013 and 2014 2014 2013 Revenue $14,146,091 $13,567,817 Cost of goods sold $-8,447,104 $-8,131,461 Selling, general, andadministrative expenses $-998,668 $-981,881 Depreciation $-1,498,161 $-1,471,091 EBIT $3,202,158 $2,983,384 Interest expense $-375,459 $-354,144 Taxes $-1,074,146 $-999,111 Net income $1,752,553 $1,630,129 Right-click on the table and select Copy to Clipboard and then right-click the highlighted texts in the popup dialogue box and select Copy in order to paste its contents…arrow_forward
- The financial statements for Tyler Toys, Inc. are shown in the popup window: LOADING... . Calculate the profit margin, return on assets, and return on equity for 2013 and 2014 for Tyler Toys. Should any of these ratios or the change in a ratio warrant concern for the managers of Tyler Toys or the shareholders? Tyler Toys, Inc. Income Statement for Years Ending December 31, 2013 and 2014 2014 2013 Revenue $14,147,690 $13,566,481 Cost of goods sold $-8,447,054 $-8,131,319 Selling, general, and administrative expenses $-998,405 $-981,658 Depreciation $-1,498,619 $-1,472,478 EBIT $3,203,612 $2,981,026 Interest expense $-376,184 $-355,975 Taxes $-1,074,423 $-997,519 Net income $1,753,005 $1,627,532 Right-click on the table and select Copy to Clipboard and then right-click the highlighted texts in the popup dialogue box and select Copy in order to paste its…arrow_forwardThe following information was available for the year ended December 31, 2016: Sales $ 460,000 Net income 66,140 Average total assets 760,000 Average total stockholders' equity 365,000 Dividends per share 1.33 Earnings per share 3.00 Market price per share at year-end 27.60 a. Calculate margin, turnover, and ROI for the year ended December 31, 2016. (Round your intermediate calculations and final answers to 2 decimal places.) b. Calculate ROE for the year ended December 31, 2016. (Round your answer to 2 decimal places.) c. Calculate the price/earnings ratio for 2016. (Round your answer to 2 decimal places.) d. Calculate the dividend payout ratio for 2016. (Round your answer to 2 decimal places.) e. Calculate the dividend yield for 2016. (Round your answer to 2 decimal places.)arrow_forwardAccess the February 21, 2017, filing of the December 31, 2016, 10-K report of The Hershey Company (ticker: HSY) at SEC.gov and complete the following requirements. Required Compute or identify the following profitability ratios of Hershey for its years ending December 31, 2016, and December 31, 2015. Interpret its profitability using the results obtained for these two years. 1. Profit margin ratio (round the percent to one decimal). 2. Gross profit ratio (round the percent to one decimal). 3. Return on total assets (round the percent to one decimal). (Total assets at year-end 2014 were $5,622,870 in thousands.) 4. Return on common stockholders’ equity (round the percent to one decimal). (Total shareholders’ equity at year-end 2014 was $1,519,530 in thousands.) 5. Basic net income per common share (round to the nearest cent).arrow_forward
- You are given the financial statements of a company for over the 6-year periods (2016 –2021). Considering 2016 as the base year, compute the trend index for the following items:a. Revenue, cost of goods sold, total expenses and net earnings. Comment on the trends of each of the items.b. Total assets, total liabilities and shareholders’ equity. Comment on the trends of each of the items.c. Cash flow from operation, cash flow from investing, cash flow from financing and closing cash balances. Comment on the trends of each of the items.arrow_forwardThe condensed financial statements of John Cully Company, for the years ended June 30, 2017 and 2016, are presented below. Compute the following ratios for 2017 and 2016. Current ratio Inventory turnover. (Inventory on 6/30/15 was $599.0.) Profit margin. Return on assets. (Assets on 6/30/15 were $3,349.9.) Return on common stockholders’ equity. (Stockholders’ equity on 6/30/15 was $1,795.9.) Debt to assets ratio. Times interest earned.arrow_forwardFINANCIAL RATIOS Required: a. Compute for the company's profitability and operating efficiency ratios in 2014. b. Compute for the financial health ratios of the company in 2014 and 2013. Very Berry Company Very Berry Company Statement of Comprehensive Income Statement of financial Position For the year ended December 31 For the year ended December 31 2014 2013 400,000 5,600,000 2014 2013 Cash 180,000 Short-term Investments 1,800,000 Sales 10,040,000 8,760,000 Accounts Receivable 1,480,000 1,060,000 Cost of Goods Sold 5,680,000 5,860,000 Inventory 1,380,000 1,640,000 4,360,000 1,160,000 Gross Profit 2,800,000 8,860,000 10,860,000 Other Current Assets 4,680,000 Operating Expenses Operating Income Interest Expense 1,680,000 Total Current Assets 5,040,000 1,20,000 28,000 3,200,000 Equipment 6,800,000 5,200,000 100,000 Total Assets 17,660,000 10,240,000 3,100,000 Accounts Payable Notes Payable - long term Owner, Capital Total Liabilities and Capital 2,620,000 2,120,000 Net Income 1,192,000…arrow_forward
- Operating data for Flounder Corp. are presented below. 2017 2016 Sales revenue $825,400 $628,400 Cost of goods sold 527,300 412,700 Selling expenses 125,600 76,800 Administrative expenses 75,500 52,800 Income tax expense 36,700 29,200 Net income 60,300 56,900 Prepare a schedule showing a vertical analysis for 2017 and 2016. (Round percentages to 1 decimal place, e.g. 12.1%.)arrow_forwardWalkie Enterprises reported sales revenue totaling $1,120,000, $1,340,000, and $1,675,000 in the years, 2014, 2015, and 2016, respectively. Performing horizontal analysis, what is the percentage change for 2016?arrow_forwardThe 2017 annual report of Tootsie Roll Industries contains the following information. (in millions) December 31, 2017 0000 December 31, 2016 Total assets $930.9 $920.1 Total liabilities 197.1 208.6 Net sales 515.7 517.4 Net income 80.7 67.2 Instructions Compute the following ratios for Tootsie Roll for 2017. a. Asset turnover. b. Return on assets. c. Profit margin on sales. d. How can the asset turnover be used to compute the return on assets?arrow_forward
arrow_back_ios
SEE MORE QUESTIONS
arrow_forward_ios
Recommended textbooks for you
 Financial AccountingAccountingISBN:9781305088436Author:Carl Warren, Jim Reeve, Jonathan DuchacPublisher:Cengage Learning
Financial Accounting
Accounting
ISBN:9781305088436
Author:Carl Warren, Jim Reeve, Jonathan Duchac
Publisher:Cengage Learning
Financial ratio analysis; Author: The Finance Storyteller;https://www.youtube.com/watch?v=MTq7HuvoGck;License: Standard Youtube License