
Concept explainers
Videos
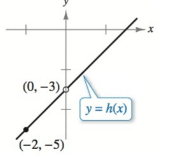
Finding Limits Graphically In Exercises 1-4, use the graph to find the limit. See Examples 1 and 2.

Trending nowThis is a popular solution!

Chapter 1 Solutions
CALCULUS APPLIED APPROACH >PRINT UGRADE<


- The graph below is the function f(x) -5 -4 -3 -2 4 -2 -3 -5+ Find lim f(x) x →2- Find lim f(x) x →2+ lim f(x) = x →2 lim f(x) does not exist. x →2 Find f(2)arrow_forwardUse the graph to find the limit. See Examples 1 and 2. y (1, -3) A (a) lim f(x) x-1 (b) lim f(x) X-4 y = f(x) (4,0) Xarrow_forwardCalculus I Evaluate lim x→1 f(x) where the graph of f(x) is.arrow_forward
- Vr- 2x -4 Let f(x) = Find lim f(x)? *+1arrow_forwardThe graph below is the function f(x) 4- 3- -4 -3 -4- -5+ Find lim f(x) = x -1 Find lim f(x) = 2 -1+ Find lim f(z) = Find f(- 1) = Question Help: DVideo Message instructorarrow_forwardUse the given graph of f to state the value of each quantity, if it exists. (If an answer does not exist, enter DNE.) y 아 4 -2 2 4 6 8 10 -2 (a) lim f(x) x-5 (b) lim f(x) x-5* (c) X-5 lim fx) (d) lim f(x) x-9 (e) f(9) 2.arrow_forward
- The graph below is the function f(x) Q3 3 -2 -3 -4 Find lim f(x) x → -1- Find lim f(æ) x → -1+ Find lim f(x) x → - 1 Find f( – 1)arrow_forwardzle: BCT5-8 Jse the graph to determine the following limits. (a) lim f(x) (b) lim f(x) Xー (c) lim f(x) Xー→3 (d) lim f(x) ズー→4 Use the graph to determine the following limits. y=f(x) 2- (a) lim f(x) (b) lim f(x) x→2 (c) lim f(x) (d) lim f(x) x-3 xー→4 -1+arrow_forwardUse a graphing utility to graph the function and visually estimate the limits. h(x) = -x² + 2x (a) lim h(x) = (b) lim h(x) = X-1arrow_forward
- Use the given graph of f to state the value of each quantity, if it exists. (If an answer does not exist, enter DNE.) 4 -2 4 (a) lim f(x) (ь) lim f(x) 2+ (c) lim, Rx) (d) F(2) (e) lim (f) f(4)arrow_forwardUse the graph below to determine the limits. lim f(x) lim f(x) x-1 x-2 lim f(x) x-3 y=f(x) 1 lim f(x) X-4 Xarrow_forwardComputational: Evaluate the limit of the following functions using the graphical, tabular and algebraic approaches. Use table of values in sketching the graph. The use of graphing software is for checking and verification purposes only. 5- V - V4 + 3x x3 -13x + 12 lim x-3 x3-14x + 15 (1) (3) lim x-7 7- x 2x*- 6x3 + x² + 3 lim 2x2 – 3x lim x-0 2 sin x (2) (4) x - 1 X-1arrow_forward
 Calculus: Early TranscendentalsCalculusISBN:9781285741550Author:James StewartPublisher:Cengage Learning
 Thomas' Calculus (14th Edition)CalculusISBN:9780134438986Author:Joel R. Hass, Christopher E. Heil, Maurice D. WeirPublisher:PEARSON
 Calculus: Early Transcendentals (3rd Edition)CalculusISBN:9780134763644Author:William L. Briggs, Lyle Cochran, Bernard Gillett, Eric SchulzPublisher:PEARSON
 Calculus: Early TranscendentalsCalculusISBN:9781319050740Author:Jon Rogawski, Colin Adams, Robert FranzosaPublisher:W. H. Freeman
 Calculus: Early Transcendental FunctionsCalculusISBN:9781337552516Author:Ron Larson, Bruce H. EdwardsPublisher:Cengage Learning