
Excel Applications for Accounting Principles
4th Edition
ISBN: 9781111581565
Author: Gaylord N. Smith
Publisher: Cengage Learning
expand_more
expand_more
format_list_bulleted
Videos
Textbook Question
Chapter 15, Problem 1R
The comparative financial statements of Global Technology are as follows:
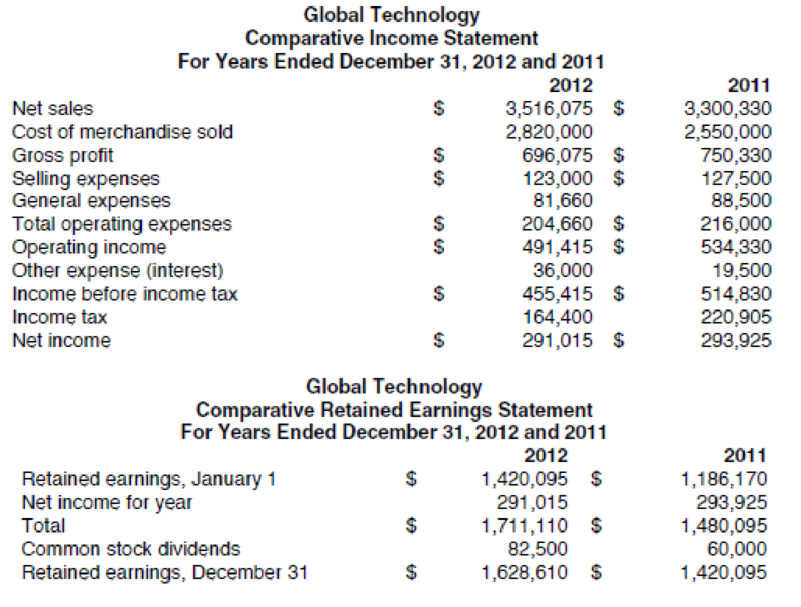
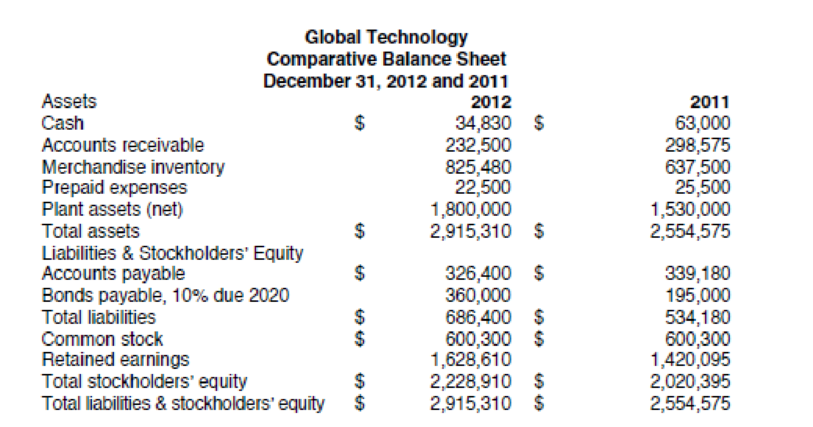
Review the worksheet RATIOA that follows these requirements. You have been asked to perform a ratio analysis of this company for 2012.
Expert Solution & Answer
To determine
Perform a ratio analysis for Company GT.
Explanation of Solution
Perform a ratio analysis for Company GT.
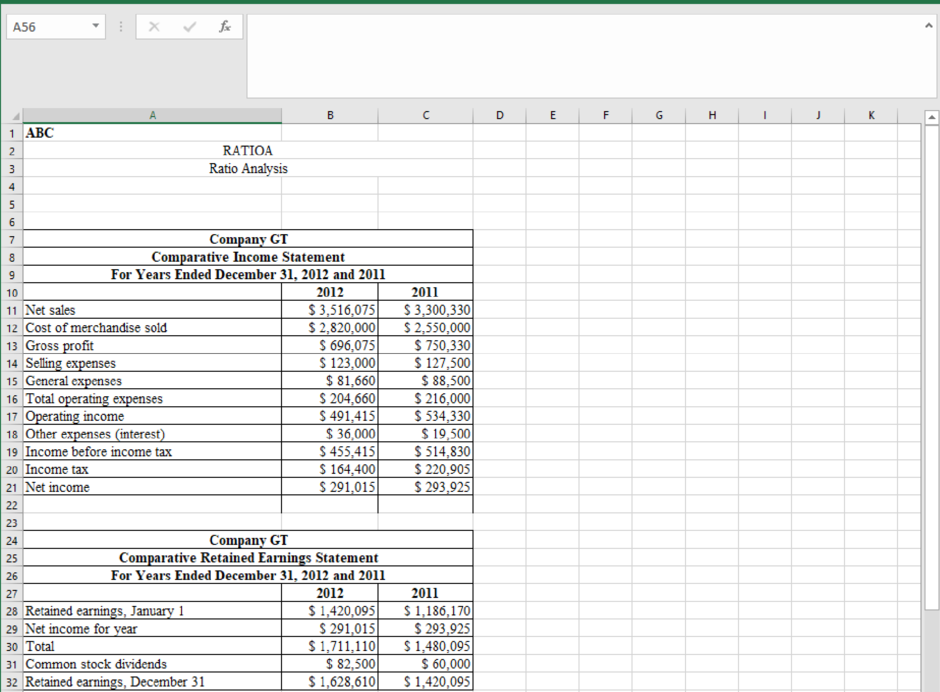
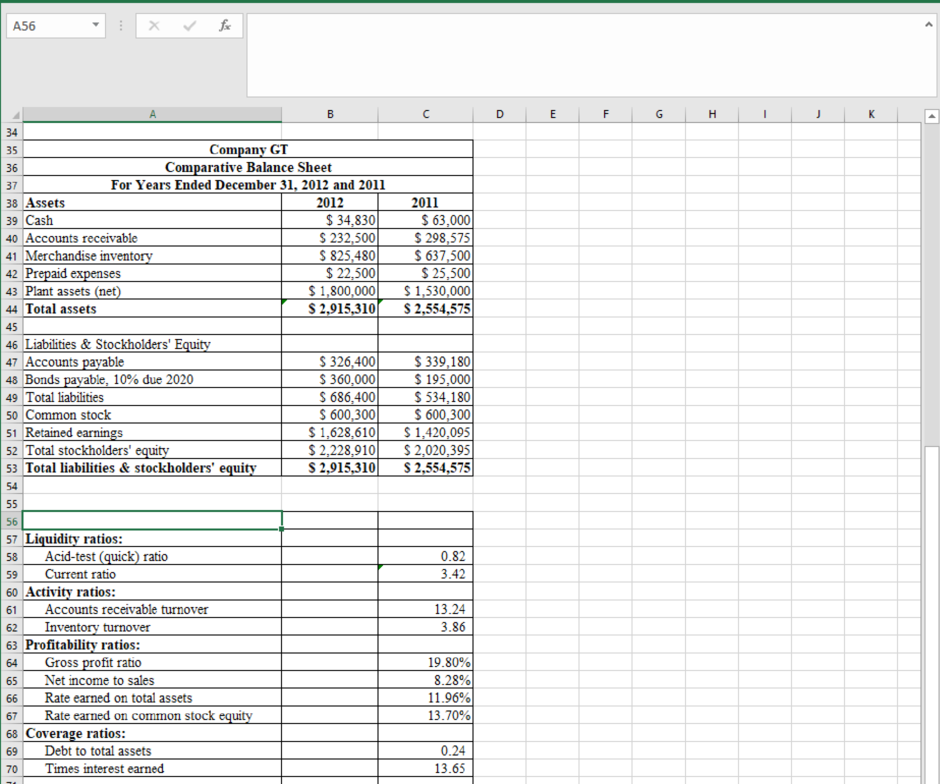
Table (1)
Want to see more full solutions like this?
Subscribe now to access step-by-step solutions to millions of textbook problems written by subject matter experts!
Students have asked these similar questions
You are provided with the Income Statement and the Balance Sheet of HTS software, Inc. for 2011.Required: (a) Calculate the ratios stated in the table below for HTS Software, Inc. for 2011 (b) Analyze the current financial position for the company from a time series and cross section viewpoint. (c) Break your analysis into an evaluation of the firm’s liquidity, activity, debt, profitability and market ratios.
A company’s comparative statements are given below. Please conduct the following analyses
(hint: use of a spreadsheet is recommended for ease of computation):a. Horizontal analysis (trend analysis) on the income statement
b. Vertical analysis (common size financial statement analysis) on the income statement
c. Calculate the three profitability ratios for the year 2017 and show how ROE can be derived from the DuPont formula for this company.
d. What do the analyses tell you about the company’s financial performance?
Base on this financial ratios, what are your conclusions and recommendations for the company
Chapter 15 Solutions
Excel Applications for Accounting Principles
Ch. 15 - The comparative financial statements of Global...Ch. 15 - The comparative financial statements of Global...Ch. 15 - a. What information does a comparison of the...Ch. 15 - Prepare a ratio analysis for Global Technology for...Ch. 15 - Compare your printout from requirement 2 with your...Ch. 15 - With the 2013 data still on the screen, click the...
Knowledge Booster


Learn more about
Need a deep-dive on the concept behind this application? Look no further. Learn more about this topic, accounting and related others by exploring similar questions and additional content below.Similar questions
- You are provided with the Income Statement and the Balance Sheet of HTS software, Inc. for 2011. Required: (a) Calculate the ratios stated in the table below for HTS Software, Inc. for 2011 (b) Analyze the current financial position for the company from a time series and cross section viewpoint. (c) Break your analysis into an evaluation of the firm’s liquidity, activity, debt, profitability and market ratios. Historical and Industry Average Ratios HTS Software , Inc. Ratio 2010 2011 Industry2011 Current Ratio 2.6 — 2.7 Quick Ratio 1.8 — 1.75 Inventory Turnover 4.5 — 4.7 Average Collection Period 40days — 42 days Total Asset Turnover 1.2 — 1 Debt Ratio 20% — 21% Times Interest Earned 9 — 8.9 Gross Profit Margin 43% — 44% Operating Profit Margin 30% — 32% Net Profit Margin 20% — 21% Return on total assets 12% — 13% Return on Equity Price/Earnings Ratio…arrow_forwardYou are provided with the Income Statement and the Balance Sheet of HTS software, Inc. for 2011. Required: (a) Calculate the ratios stated in the table below for HTS Software, Inc. for 2011 (b) Analyze the current financial position for the company from a time series and cross section viewpoint. (c) Break your analysis into an evaluation of the firm’s liquidity, activity, debt, profitability and market ratios. Historical and Industry Average Ratios HTS Software , Inc. Ratio 2010 2011 Industry2011 Current Ratio 2.6 — 2.7 Quick Ratio 1.8 — 1.75 Inventory Turnover 4.5 — 4.7 Average Collection Period 40days — 42 days Total Asset Turnover 1.2 — 1 Debt Ratio 20% — 21% Times Interest Earned 9 — 8.9 Gross Profit Margin 43% — 44% Operating Profit Margin 30% — 32% Net Profit Margin 20% — 21% Return on total assets 12% — 13% Return on Equity Price/Earnings Ratio…arrow_forwardA company’s comparative statements are given below. Please conduct the following analyses: c. Calculate the three profitability ratios for year 2017 and show how ROE can be derived from the DuPont formula for this company. d. What do the analyses tell you about the company’s financial performance?arrow_forward
- Using the data for 2018 and the industry norms, compute the financial ratios that were discussed in this chapter (current ratio, return on assets, operating profit margin, total asset turnover, debt ratio, and return on equity).arrow_forwardHow you can assess the company’s performance with financial ratios? Select any company and analyzes the current situation of financial statements with the help of rations.arrow_forwardYou are given financial statements and a Dupont analysis for Tesco and Ahold. What do you conclude about the two companies’ performances based on these numbers?arrow_forward
- - Please refer to the following Income Statement and Balance Sheet (see attached picture): Prepare a vertical analysis for both the income statement and balance sheet. Write a paragraph comparing the company’s performance with the industry average. Compute the following ratios and comment on what the results mean when evaluating the company: Current ratio Gross profit percentage ratio Debt ratio Profit margin ratioarrow_forward. Using the calculated different ratios for Abcam in 2015 below. Comment on your result and contrast with the evolution in 2016 and 2017. At the end of each type of ratio, provide a short paragraph that gives a final note on the outlook for the company. Last, provide a final paragraph that summarise Abcam’s financial situation and give your recommendations to the management.arrow_forwarda) Compute the above indicated ratios for DEL Bhd. b) Evaluate the overall performance of the company as compared to the industry average ratios.arrow_forward
- Prepare a ratio analysis for Global Technology for 2013. The following information is available for 2013: The 2013 information should be entered in column B of the RATIOA2 worksheet. The 2012 information should be entered in column C. Save the revised file as RATIOA4. Print the worksheet when done.arrow_forwardWhat does the below financial statement tell you about Nealon, Inc? This analysis uses accounting reports for an understanding of a company’s current economic condition and project into the future. A financial analysis allows management and owners to plan, correct and proceed properly for the best success. Review and analyze the following Financial Statement using horizontal analysis and ratios. Please be as descriptive as possible.arrow_forwardCompare the resulting ratios of P and P Manufacturing Company for 2018 (per your computation) with its competitors in the table given below.arrow_forward
arrow_back_ios
SEE MORE QUESTIONS
arrow_forward_ios
Recommended textbooks for you

 Excel Applications for Accounting PrinciplesAccountingISBN:9781111581565Author:Gaylord N. SmithPublisher:Cengage Learning
 Financial Reporting, Financial Statement Analysis...FinanceISBN:9781285190907Author:James M. Wahlen, Stephen P. Baginski, Mark BradshawPublisher:Cengage Learning
Excel Applications for Accounting Principles
Accounting
ISBN:9781111581565
Author:Gaylord N. Smith
Publisher:Cengage Learning
Financial Reporting, Financial Statement Analysis...
Finance
ISBN:9781285190907
Author:James M. Wahlen, Stephen P. Baginski, Mark Bradshaw
Publisher:Cengage Learning
How To Analyze an Income Statement; Author: Daniel Pronk;https://www.youtube.com/watch?v=uVHGgSXtQmE;License: Standard Youtube License