
Concept explainers
Videos
Refer to the Buena School District bus data.
- a. Suppose we consider a bus “old” if it has been in service more than 8 years. At the .01 significance level, can we conclude that less than 40% of the district’s buses are old? Report the p-value.
- b. Find the median maintenance cost and the median age of the buses. Organize the data into a two-by-two contingency table, with buses above and below the median of each variable. Determine whether the age of the bus is related to the amount of the maintenance cost. Use the .05 significance level.
- c. Is there a relationship between the maintenance cost and the manufacturer of the bus? Use the breakdown in part (b) for the buses above and below the median maintenance cost and the bus manufacturers to create a contingency table. Use the .05 significance level.
a.
Check whether one can conclude that less than 40% of the district buses are old.
Find the p-value.
Answer to Problem 64DE
It cannot be concluded that less than 40% of the district buses are old.
The p-value is 0.181.
Explanation of Solution
Let
The null and alternative hypotheses are stated as follows:
The sample proportion of the old buses can be obtained as follows:
Thus, the sample proportion of the old buses is 0.35.
The sample size n is 80 and
Step-by-step procedure to find the test statistic using the MINITAB software:
- Choose Stat > Basic Statistics > 1 Proportion.
- Choose Summarized data.
- In Number of events, enter 28. In Number of trials, enter 80.
- Enter Hypothesized proportion as 0.40.
- Check Options, enter Confidence level as 99.0.
- Choose less than in alternative.
- Select Method as Normal approximation.
- Click OK in all dialogue boxes.
Output is obtained as follows:
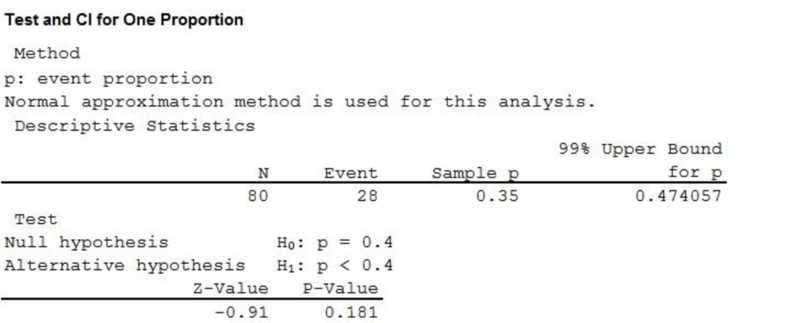
Thus, the value of the test statistic is –0.91and the p-value is 0.181.
Decision rule:
If the p-value is less than the significance level, reject the null. Otherwise, fail to reject the null hypothesis.
Conclusion:
The significance level is 0.01 and the p-value is 0.181. Here, the p-value is greater than the significance level 0.01. By the rejection rule, fail to reject the null hypothesis.
Therefore, one cannot conclude that less than 40% of the district buses are old.
b.
Find the median maintenance cost.
Find the median age of the buses.
Construct a two-way contingency table for the maintenance cost and age of the buses.
Check whether there is a relationship between the age of the buses and maintenance cost.
Answer to Problem 64DE
The median maintenance cost is $456.
The median age of the bus is 4.5 years.
The age of the bus is related to the amount of the maintenance cost.
Explanation of Solution
The median maintenance cost for the bus is calculated as follows:
First, arrange the data into ascending or descending order and then, find the median for the maintenance cost. Since there is even number of observations in the maintenance cost variable, the median is the average of the 40th and 41th observations. That is,
Thus, the median maintenance cost is $456.
The median age of the bus can be obtained as follows:
First, arrange the data into ascending or descending order and then, find the median of the bus. Therefore, the median is the average of the 40th and 41th observations. That is,
Thus, the median age of the bus is 4.5 years.
The contingency table for the maintenance cost and age of the buses is as follows:
| Maintenance cost | Age | ||
| Below median | Above median | Total | |
| Below median | 29 | 11 | 40 |
| Above median | 13 | 27 | 40 |
| Total | 42 | 38 | 80 |
The null and alternative hypotheses are stated below:
The number of degrees of freedom for a contingency table is obtained as follows:
Therefore, the number of degrees of freedom is 1.
Step-by-step procedure to find the test statistic using the MINITAB software:
- Choose Stat > Tables > Chi-Square Test for Association.
- Choose Summarized data in a two-way table.
- In Columns containing the table, enter the columns of Less than median age, and More than median age.
- Under Labels for the table, in Rows enter Maintenance cost and in the columns enter the Age.
- Click OK.
Output obtained using Minitab is as follows:
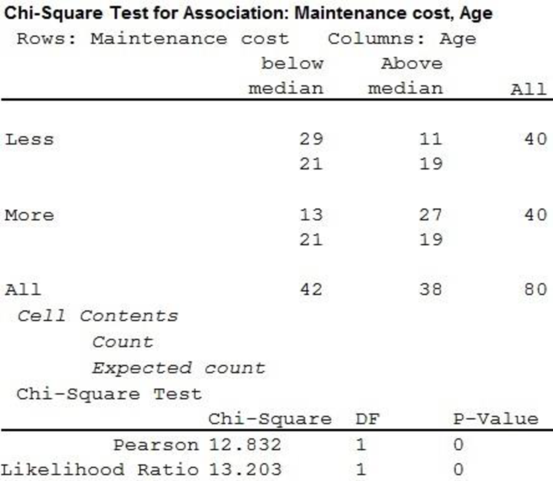
From the above output, the value of the test statistic is 12.832 and the p-value is 0.000.
Conclusion:
The significance level is 0.05 and the p-value is 0.000.
Here, the p-value is less than the significance level 0.05. By the rejection rule, reject the null hypothesis at the 0.05 significance level.
Thus, it can be concluded that the age of the bus is related to the amount of the maintenance cost.
c.
Check whether there is a relationship between the maintenance cost and manufacturer of the bus.
Answer to Problem 64DE
There is a relationship between the maintenance cost and the manufacturer of the bus.
Explanation of Solution
The contingency table for the maintenance cost and manufacturer of the bus is as follows:
| Maintenance cost | Manufacturer | |||
| Bluebird | Keiser | Thompson | Total | |
| Below median | 26 | 14 | 0 | 40 |
| Above median | 21 | 11 | 8 | 40 |
| Total | 47 | 25 | 8 | 80 |
The null and alternative hypotheses are stated below:
The number of degrees of freedom is obtained as follows:
Therefore, the number of degrees of freedom is 1.
Step-by-step procedure to find the test statistic using the MINITAB software:
- Choose Stat > Tables > Chi-Square Test for Association.
- Choose Summarized data in a two-way table.
- In Columns containing the table, enter the columns of below median manufacturer, and above median manufacturer.
- Under Labels for the table, in Rows enter Maintenance cost and in the columns enter the Manufacturer.
- Click OK
Output obtained using Minitab is as follows:
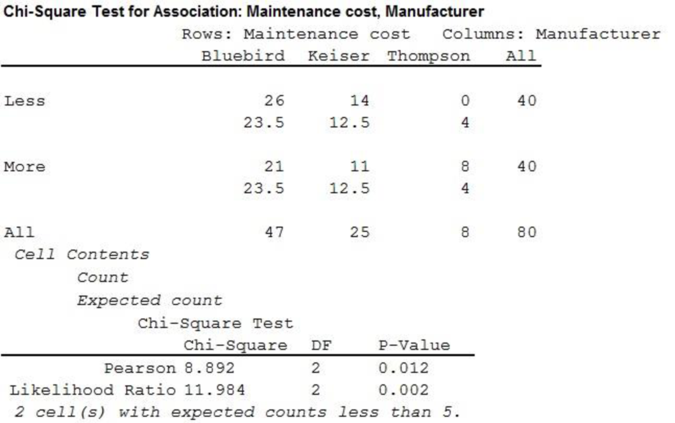
From the above output, the value of the test statistic is 8.892 and the p-value is 0.012.
Conclusion:
The significance level is 0.05 and the p-value is 0.012.
Here, the p-value is less than the significance level 0.05. By the rejection rule, reject the null hypothesis at the 0.05 significance level.
Therefore, there is a relationship between the maintenance cost and the manufacturer.
Want to see more full solutions like this?
Chapter 15 Solutions
Statistical Techniques in Business and Economics, 16th Edition


 College Algebra (MindTap Course List)AlgebraISBN:9781305652231Author:R. David Gustafson, Jeff HughesPublisher:Cengage Learning
 Glencoe Algebra 1, Student Edition, 9780079039897...AlgebraISBN:9780079039897Author:CarterPublisher:McGraw Hill