
Videos
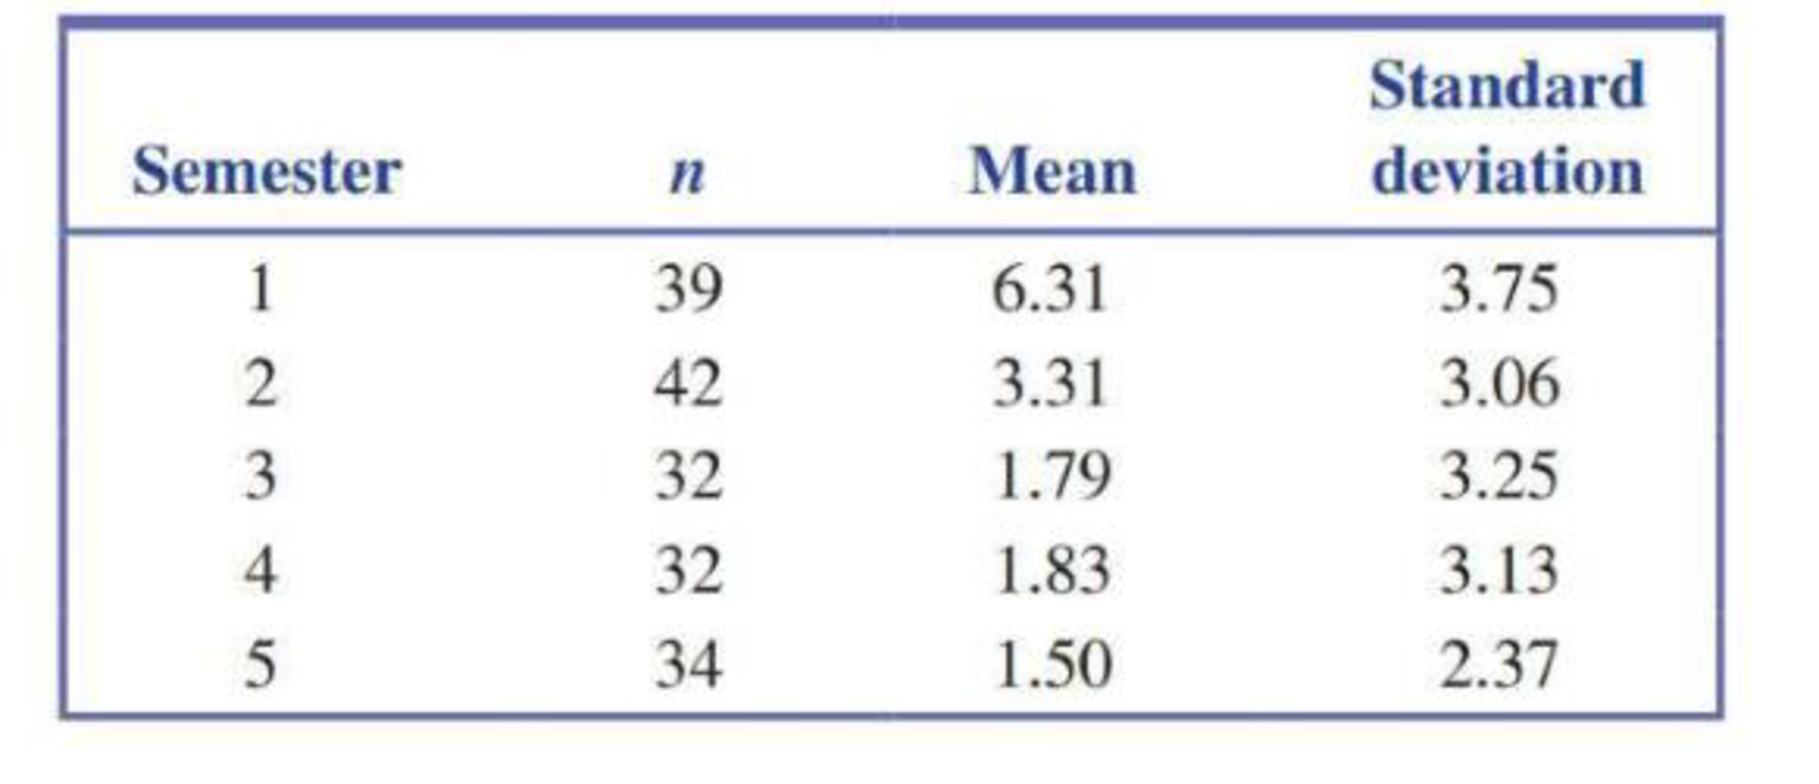
Can use of an online plagiarism-detection system reduce plagiarism in student research papers? The paper “Plagiarism and Technology: A Tool for Coping with Plagiarism” (Journal of Education for Business [2005]: 149–152) describes a study in which randomly selected research papers submitted by students during five semesters were analyzed for plagiarism. For each paper, the percentage of plagiarized words in the paper was determined by an online analysis. In each of the five semesters, students were told during the first two class meetings that they would have to submit an electronic version of their research papers and that the papers would be reviewed for plagiarism. Suppose that the number of papers sampled in each of the five semesters and the means and standard deviations for percentage of plagiarized words are as given in the accompanying table.
For purposes of this exercise, assume that the conditions necessary for the ANOVA F test are reasonable. Do these data provide evidence to support the claim that mean percentage of plagiarized words is not the same for all five semesters? Test the appropriate hypotheses using α = 0.05.
Check whether the data provides convincing evidence that the mean percentage of plagiarized words is not same for all five semesters with relevant hypothesis test at 0.05 level of significance.
Answer to Problem 10E
There is a convincing evidence that the mean ratings are not equal for all four label populations at 0.01 level of significance.
Explanation of Solution
Calculation:
The mean and standard deviation for percentage of plagiarized word and the number of papers sampled in each of the five semesters is given in the table.
Step 1:
Assume that
Step 2:
Null hypothesis:
Hence, the mean percentages of plagiarized words are same for five semesters.
Step 3:
Alternative hypothesis:
Hence, the mean percentages of plagiarized words are not same for five semesters.
Step 4:
Significance level:
Step 5:
Test statistic:
Here, MSTr is the mean sum of squares for treatment and MSE is the mean sum of squares for errors.
Step 6:
Assumptions:
It is given to assume that the conditions necessary for the ANOVA F test are reasonable.
Step 7:
Calculation:
The total number of observations is calculated as follows:
The grand mean is calculated as follows:
The value of sum of squares for treatments is calculated as follows:
The value of sum of squares for errors is calculated as follows:
The degrees of freedom for treatments is calculated as follows:
The degrees of freedom for errors is calculated as follows:
The value of mean sum of squares for treatments is calculated as follows:
The value of mean sum of squares for errors is calculated as follows:
The value of F test statistic is calculated as follows:
Step 8:
P-value:
Software procedure:
A step-by-step procedure to find P-value using MINITAB software is as follows:
- Choose Graph > Probability Distribution Plot, choose View Probability > OK.
- From Distribution, choose ‘F’ distribution.
- Enter the Numerator df as 4 and Denominator df as 174.
- Click the Shaded Area tab.
- Choose X Value and Right Tail for the region of the curve to shade.
- Enter the X value as 14.975.
- Click OK.
Output obtained using MINITAB software is as follows:
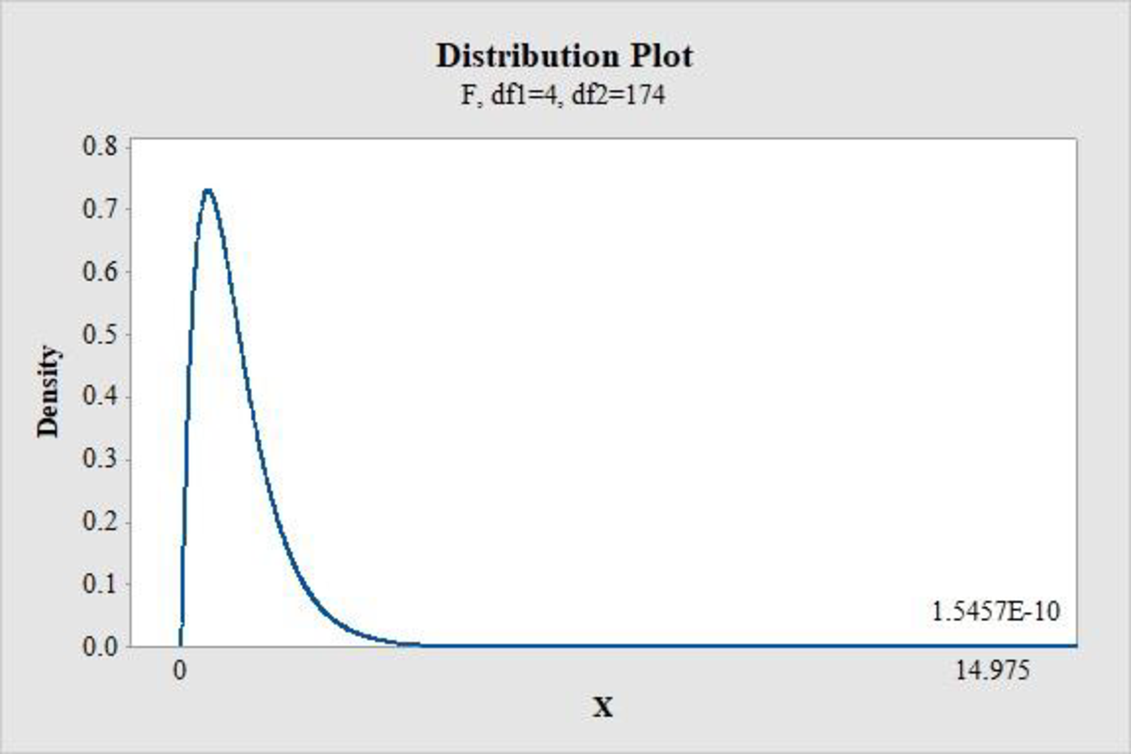
From MINITAB output, the P-value is 0.000.
Step 9:
Decision rule:
If
Conclusion:
Here,
Since, P-value of 0 is less than the 0.05 level of significance.
Hence, reject the null hypothesis.
Thus, it can be concluded that there is a convincing evidence that the mean percentage of plagiarized words are not equal for five semesters.
Want to see more full solutions like this?
Chapter 15 Solutions
Introduction To Statistics And Data Analysis


- What is meant by the sample space of an experiment?arrow_forwardA study, which randomly surveyed 3,700 households and drew on this information from the IRS, found that 79% of households have conducted at least one IRA rollover from an employer-sponsored retirement plan. Suppose a recent random sample of 90 households in a certain county was taken and respondents were asked whether they had ever funded an IRA account with a rollover from an employer-sponsored retirement plan. Based on the sample data below, can you conclude at the 0.10 level of significance that the proportion of households in the county that have funded an IRA with a rollover is different from the proportion for all households reported in the study? 77 respondents said they had funded an account; 13 respondents said they had notarrow_forwardIn a study, 28 adults with mild periodontal disease are assessed before and 6 months after implementation of a dental-education program intended to promote better oral hygiene. After 6 months, periodontal status improved in 15 patients, declined in 8, and remained the same in 5.9.1 Assess the impact of the program statistically (use a two-sided test).arrow_forward
- Although there is a popular belief that herbal remedies such as Ginkgo biloba and Ginseng may improve learning and memory in healthy adults, these effects are usually not supported by well- controlled research (Persson, Bringlov, Nilsson, and Nyberg, 2004). In a typical study, a researcher obtains a sample of n = 16 participants and has each person take the herbal supplements every day for 90 days. At the end of the 90 days, each person takes a standardized memory test. For the general population, scores from the test form a normal distribution with a mean of μ = 50 and a standard deviation of σ = 12. The sample of research participants had an average of M = 54. A) Assuming a two-tailed test, state the null hypothesis in a sentence that includes the two variables being examined. B) Using the standard 4-step procedure, conduct a two-tailed hypothesis test with α = .05 to evaluate the effect of the supplements.arrow_forwardSuppose that a random sample of firms with impaired assets was classified according to whether discretionary write-downs of these assets were taken, and also according to whether there was evidence of subsequent merger or acquisition activity. Using the data in the accompanying table, test the null hypothesis of no association between these characteristics. Write-Down Merger or Acquisition Activity? Yes No Yes 32 48 No 25 57arrow_forwardIn a clinical study of an allergy drug 98 of the 202 subjects reported experiencing significant relief from their symptoms. At the 0.01 significance level, test the claim that at least half of those using the drug experience relief.arrow_forward
- In a study of cell phone use and brain hemispheric dominance, an internet survey was e-mailed to 5000 subjects randomly selected from an online group involved with ears. 717 surveys were returned. Use a 0.01 significance level to test the claim that the return rate is less than 15%.arrow_forwardThe article “HIV-positive Smokers Considering Quitting: Differences by Race/Ethnicity” (E. Lloyd-Richardson, C. Stanton, et al., Am J Health Behav, 2008:3–15) reported that in a group of 230 European-American HIV-positive smokers, 102 of them had used a nicotine patch to try to quit smoking, and in a group of 72 Hispanic-American HIV-positive smokers, 20 had used a nicotine patch. Can you conclude that the proportion of patch users is greater among European-Americans?arrow_forwardTo test the fairness of law enforcement in its area, a local citizens’ group wants to know whether women and men are unequally likely to get speeding tickets. Five hundred randomly selected adults were phoned and asked whether or not they had been cited for speeding in the last year. Using the results in the following table and a 0.100.10 level of significance, test the claim of the citizens’ group. Let men be Population 1 and let women be Population 2. Speeding Tickets Ticketed Not Ticketed Men 5555 174174 Women 4545 226226 Step 2: compute test value.. round to 2 decimal places Step 3: draw a conclusion and interpret the conclusion.arrow_forward
- In a controlled laboratory experiment, scientists at the University of Minnesota discovered that 25% of a certain strain of rats subjected to a 20% coffee bean diet and then force-fed a powerful cancer-causing chemical later developed cancerous tumors. Would we have reason to believe that the proportion of rats developing tumors when subjected to this diet has increased if the experiment were repeated and 16 of 48 rats developed tumors? Use a 0.05 level of significance.arrow_forwardTo test the fairness of law enforcement in its area, a local citizens’ group wants to know whether women and men are unequally likely to get speeding tickets. Four hundred randomly selected adults were phoned and asked whether or not they had been cited for speeding in the last year. Using the results in the following table and a 0.02 level of significance, test the claim of the citizens’ group. Let men be Population 1 and let women be Population 2. Speeding Tickets Ticketed Not Ticketed Men 28 152 Women 20 200 Step 1 of 3: State the null and alternative hypotheses for the test. Fill in the blank below. H0: p1=p2 Ha: p1__p2 Step 2 of 3: Compute the value of the test statistic. Round your answer to two decimal places Step 3 of 3: Draw a conclusion and interpret the decision.arrow_forwardIn a study of the effects of early Alzheimer’s disease on nondeclarative memory, Reber et al. (A-2) used the Category Fluency Test to establish baseline persistence and semantic memory and language abilities. The eight subjects in the sample had Category Fluency Test scores of 11, 10, 16, 13, 21, 30, 19, 15, 25, 11. Assume that the eight subjects constitute a simple random sample from a normally distributed population of similar subjects with early Alzheimer’s disease. (a) What is the point estimate of the population mean? (b) What is the standard deviation of the sample? (c) What is the estimated standard error of the sample mean? (d) Construct a 95 percent confidence interval for the population mean category fluency test score. (e) What is the precision of the estimate? (f) State the probabilistic interpretation of the confidence interval you constructed. (g) State the practical interpretation of the confidence interval you constructed. I- Explain the practical interpretation…arrow_forward
 Holt Mcdougal Larson Pre-algebra: Student Edition...AlgebraISBN:9780547587776Author:HOLT MCDOUGALPublisher:HOLT MCDOUGAL
 College Algebra (MindTap Course List)AlgebraISBN:9781305652231Author:R. David Gustafson, Jeff HughesPublisher:Cengage Learning