
Videos
Instructions: For each exercise, include software results (e.g., from Excel, MegaStat, or JMP) to support your chi-square calculations. (a) State the hypotheses. (b) Show how the degrees of freedom are calculated for the contingency table. (c) Using the level of significance specified in the exercise, find the critical value of chi-square from Appendix E or from Excel’s
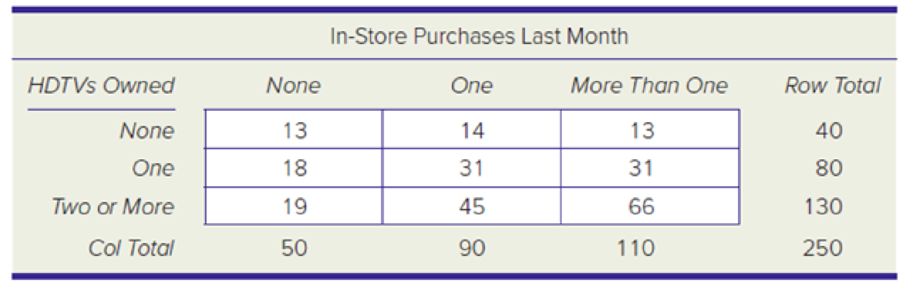
15.4 Is HDTV ownership related to quantity of purchases of other electronics? A Best Buy retail outlet collected the following data for a random sample of its recent customers. Research question: At α = .10, is the frequency of in-store purchases independent of the number of large-screen HDTVs owned (defined as 50 inches or more)?
Want to see the full answer?
Check out a sample textbook solution
Chapter 15 Solutions
APPLIED STAT.IN BUS.+ECONOMICS


- If Elliot collects data from a single sample and her dependent variable is assessed on a nominal scale, which of these difference tests would Elliot need to use to analyze her data? A. a single-sample t test B. a single-sample z test C. a between-subjects ANOVA D. a chi-square goodness-of-fit testarrow_forwardRefer to the data display from a sample of airport data speeds in Mbps. What is the number of degrees of freedom that should be used for finding the critical value ta/2 ?arrow_forwardCompare the two separate scatterplots. In particular, how do the associtation compare between women with pets vs. women without pets? Does one group have more variation in systolic blood pressure than the other? If so, for which group? Does systolic blood pressure seem higher for common ages between the two groups? If so, for which group?arrow_forward
- If Elliot collects data from a single sample and her dependent variable is assessed on a nominal scale, which of these difference tests would Elliot need to use to analyze her data? a. single sample t test b. between-subjects, one-way ANOVA. c. chi square goodness of fit test d. single-sample z testarrow_forwardDefine the following twr5: A. Estimation B. Estimator C. Estimate And state the methods used in the Estimation of parameters in a point Estimatearrow_forwardWhat is the x^2 test stat and critical chi value for the following problem? Thanks in advancearrow_forward
- State the t critical value that would be used for a 99% interval based on a sample size of 37.arrow_forwardBy comparing Tables Six and Nine, discuss the impacts on the estimation results ifheteroskedasticity is present.arrow_forwardAs the population ages, there is increasing concern about accident-related injuries to the elderly. An article reported on an experiment in which the maximum lean angle—the farthest a subject is able to lean and still recover in one step—was determined for both a sample of younger females (21–29 years) and a sample of older females (67–81 years). The following observations are consistent with summary data given in the article: YF: 28, 34, 32, 27, 28, 32, 31, 35, 32, 28 OF: 19, 14, 21, 13, 12 Does the data suggest that true average maximum lean angle for older females (OF) is more than 10 degrees smaller than it is for younger females (YF)? State and test the relevant hypotheses at significance level 0.10. (Use ?1 for younger females and ?2 for older females.) H0: ?1 − ?2 = 10Ha: ?1 − ?2 > 10H0: ?1 − ?2 = 10Ha: ?1 − ?2 < 10 H0: ?1 − ?2 = 0Ha: ?1 − ?2 > 0H0: ?1 − ?2 = 0Ha: ?1 − ?2 < 0 Calculate the test statistic and determine the P-value. (Round your test…arrow_forward
- As the population ages, there is increasing concern about accident-related injuries to the elderly. An article reported on an experiment in which the maximum lean angle—the farthest a subject is able to lean and still recover in one step—was determined for both a sample of younger females (21–29 years) and a sample of older females (67–81 years). The following observations are consistent with summary data given in the article: YF: 28, 34, 32, 27, 28, 32, 31, 35, 32, 28 OF: 19, 14, 21, 13, 12 Calculate the test statistic and determine the P-value. (Round your test statistic to one decimal place and your P-value to three decimal places.) t = P-value =arrow_forwardDr. Castillejo feels that the maximum pulse rate during the run is a good predictor in explaining the oxygen consumption in the blood stream. He asserts that if the pulse rate at the end of the run increased, then the oxygen consumption will also increase, hence his/her heart is functioning well. Based on the R commanderoutput below, check if the data on oxygen consumption and maximum pulse rate (from 152 bpm to 196bpm) support Dr. Castillejo’s assertion.arrow_forwardPART D) Find the critical value. (Round to three or more decimal places.) ANSWER:arrow_forward
 Glencoe Algebra 1, Student Edition, 9780079039897...AlgebraISBN:9780079039897Author:CarterPublisher:McGraw Hill