
Videos
Instructions: In all exercises, include software results (e.g., from Excel, MegaStat, or Minitab) to support your calculations. State the hypotheses, show how the degrees of freedom are calculated, find the critical value of chi-square from Appendix E or from Excel’s
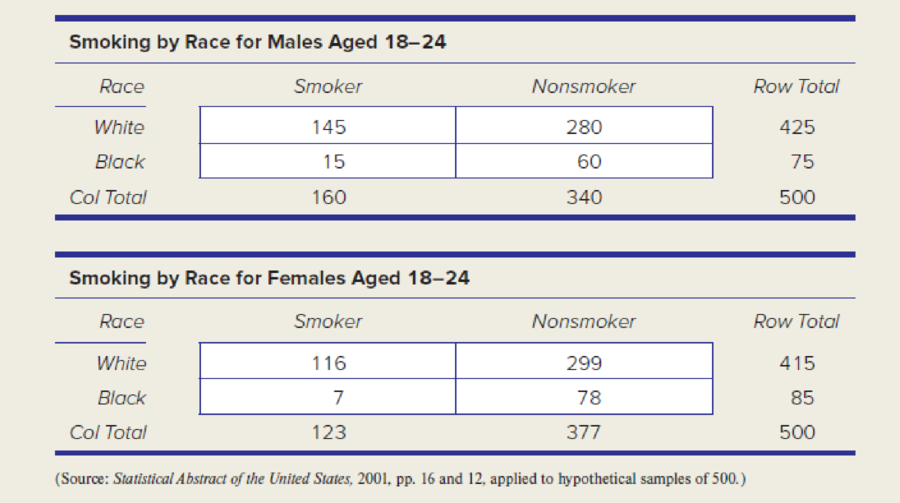
Choose either 2 × 2 contingency table shown below (males or females). Research question: At α = .005, is smoking independent of race?
Want to see the full answer?
Check out a sample textbook solution
Chapter 15 Solutions
APPLIED STAT.IN BUS.+ECONOMICS


- Calculate the X² statistic then compare it with the critical value to determine if we will reject or fail to reject the null hypothesis that "There is no difference in the proportion of students that choose STEM, Social Sciences and Liberal Arts"arrow_forwardThe personality trait of "Conscientiousness" (someone who is organized, responsible, and can control their impulses) has μ = 120 and σ =9. Test whether ARC students (n = 9, M = 126) differ on Conscientiousness. α = .05. Does the z score for the sample mean lie in the critical region (beyond the critical boundary)?arrow_forwardThe critical value(s) is/are t0= ? Find the standardized test statistic ? Decide whether to reject or fail to reject the null hypothesis.? Interpret the decision in the context of the original claim. ?arrow_forward
- Refer to the data display from a sample of airport data speeds in Mbps. What is the number of degrees of freedom that should be used for finding the critical value ta/2 ?arrow_forwardA third study is run to estimate the effect of the low-carbohydrate diet on cholesterol levels. In the study, participants' cholesterol levels are measured before starting the program and then again after 6 months on the program. The datar are shown below. Is there a significant increase in cholesterol after 6 months on the low-carbohydrate diet? Run the appropriate test at a 5% level of significance.arrow_forwardAverage IQ scores for young school children are known to be 100 (SD = 15). However, the literature indicates that children’s intelligence may be decreased if their mothers have German measles during pregnancy. Using hospital records, a researcher obtained a sample of n = 25 school children whose mothers all had German measles during their pregnancies. Do the data indicate that children born to mothers who had German measles during the pregnancy have significantly lower IQ scores than typical young school children? child IQ scr 1 91 2 111 3 97 4 95 5 96 6 95 7 95 8 96 9 94 10 93 11 95 12 92 13 96 14 91 15 97 16 93 17 92 18 99 19 93 20 97 21 85 22 94 23 96 24 95 25 96 A. Is the dependent variable categorical or quantitative? A B. What is the mean IQ for the sample? B C. What is the sample standard deviation? C D. What…arrow_forward
- Dr. Castillejo feels that the maximum pulse rate during the run is a good predictor in explaining the oxygen consumption in the blood stream. He asserts that if the pulse rate at the end of the run increased, then the oxygen consumption will also increase, hence his/her heart is functioning well. Based on the R commanderoutput below, check if the data on oxygen consumption and maximum pulse rate (from 152 bpm to 196bpm) support Dr. Castillejo’s assertion.arrow_forwardUse SPSS to run the analysis described in Question 6. What is the obtained t-statistic? Enter the value with three decimal places. If it is negative, be sure to include the sign.arrow_forwardUse Spearman rho to test the hypothesis at 5% level of significance in which there is no significant correlation between mental ability and English proficiency. What is the value of ΣD2? What is the absolute calculated ρ(rho) value? Using the tabulated value ρtab = 0.648, what is the decision? accept or reject Ho?arrow_forward
- The lower quartile (Q1) height for JV players is the same as the ______ for Varsity players.arrow_forwardCalculate the F statistic for the model. Test whether R square is equal to ‘0’ at the 5% significance level if the critical F value is 2.71.arrow_forwardIs the statement below correct? Explain."The calculated t-value is greater than the critical T-value from the table, hence we reject the null hypothesis, therefore the alternative hypothesis is correct."arrow_forward
 Glencoe Algebra 1, Student Edition, 9780079039897...AlgebraISBN:9780079039897Author:CarterPublisher:McGraw Hill