
Concept explainers
Videos
The experiment described in Example 15.4 also gave data on change in body fat mass for men (“Growth Hormone and Sex Steroid Administration in Healthy Aged Women and Men,” Journal of the American Medical Association [2002]: 2282–2292). Each of 74 male subjects who were over age 65 was assigned at random to one of the following four treatments:
- 1. placebo “growth hormone” and placebo “steroid” (denoted by P + P);
- 2. placebo “growth hormone” and the steroid testosterone (denoted by P + S);
- 3. growth hormone and placebo “steroid” (denoted by G + P); and
- 4. growth hormone and the steroid testosterone (denoted by G + S).
The accompanying table lists data on change in body fat mass over the 26-week period following the treatment that are consistent with summary quantities given in the article.
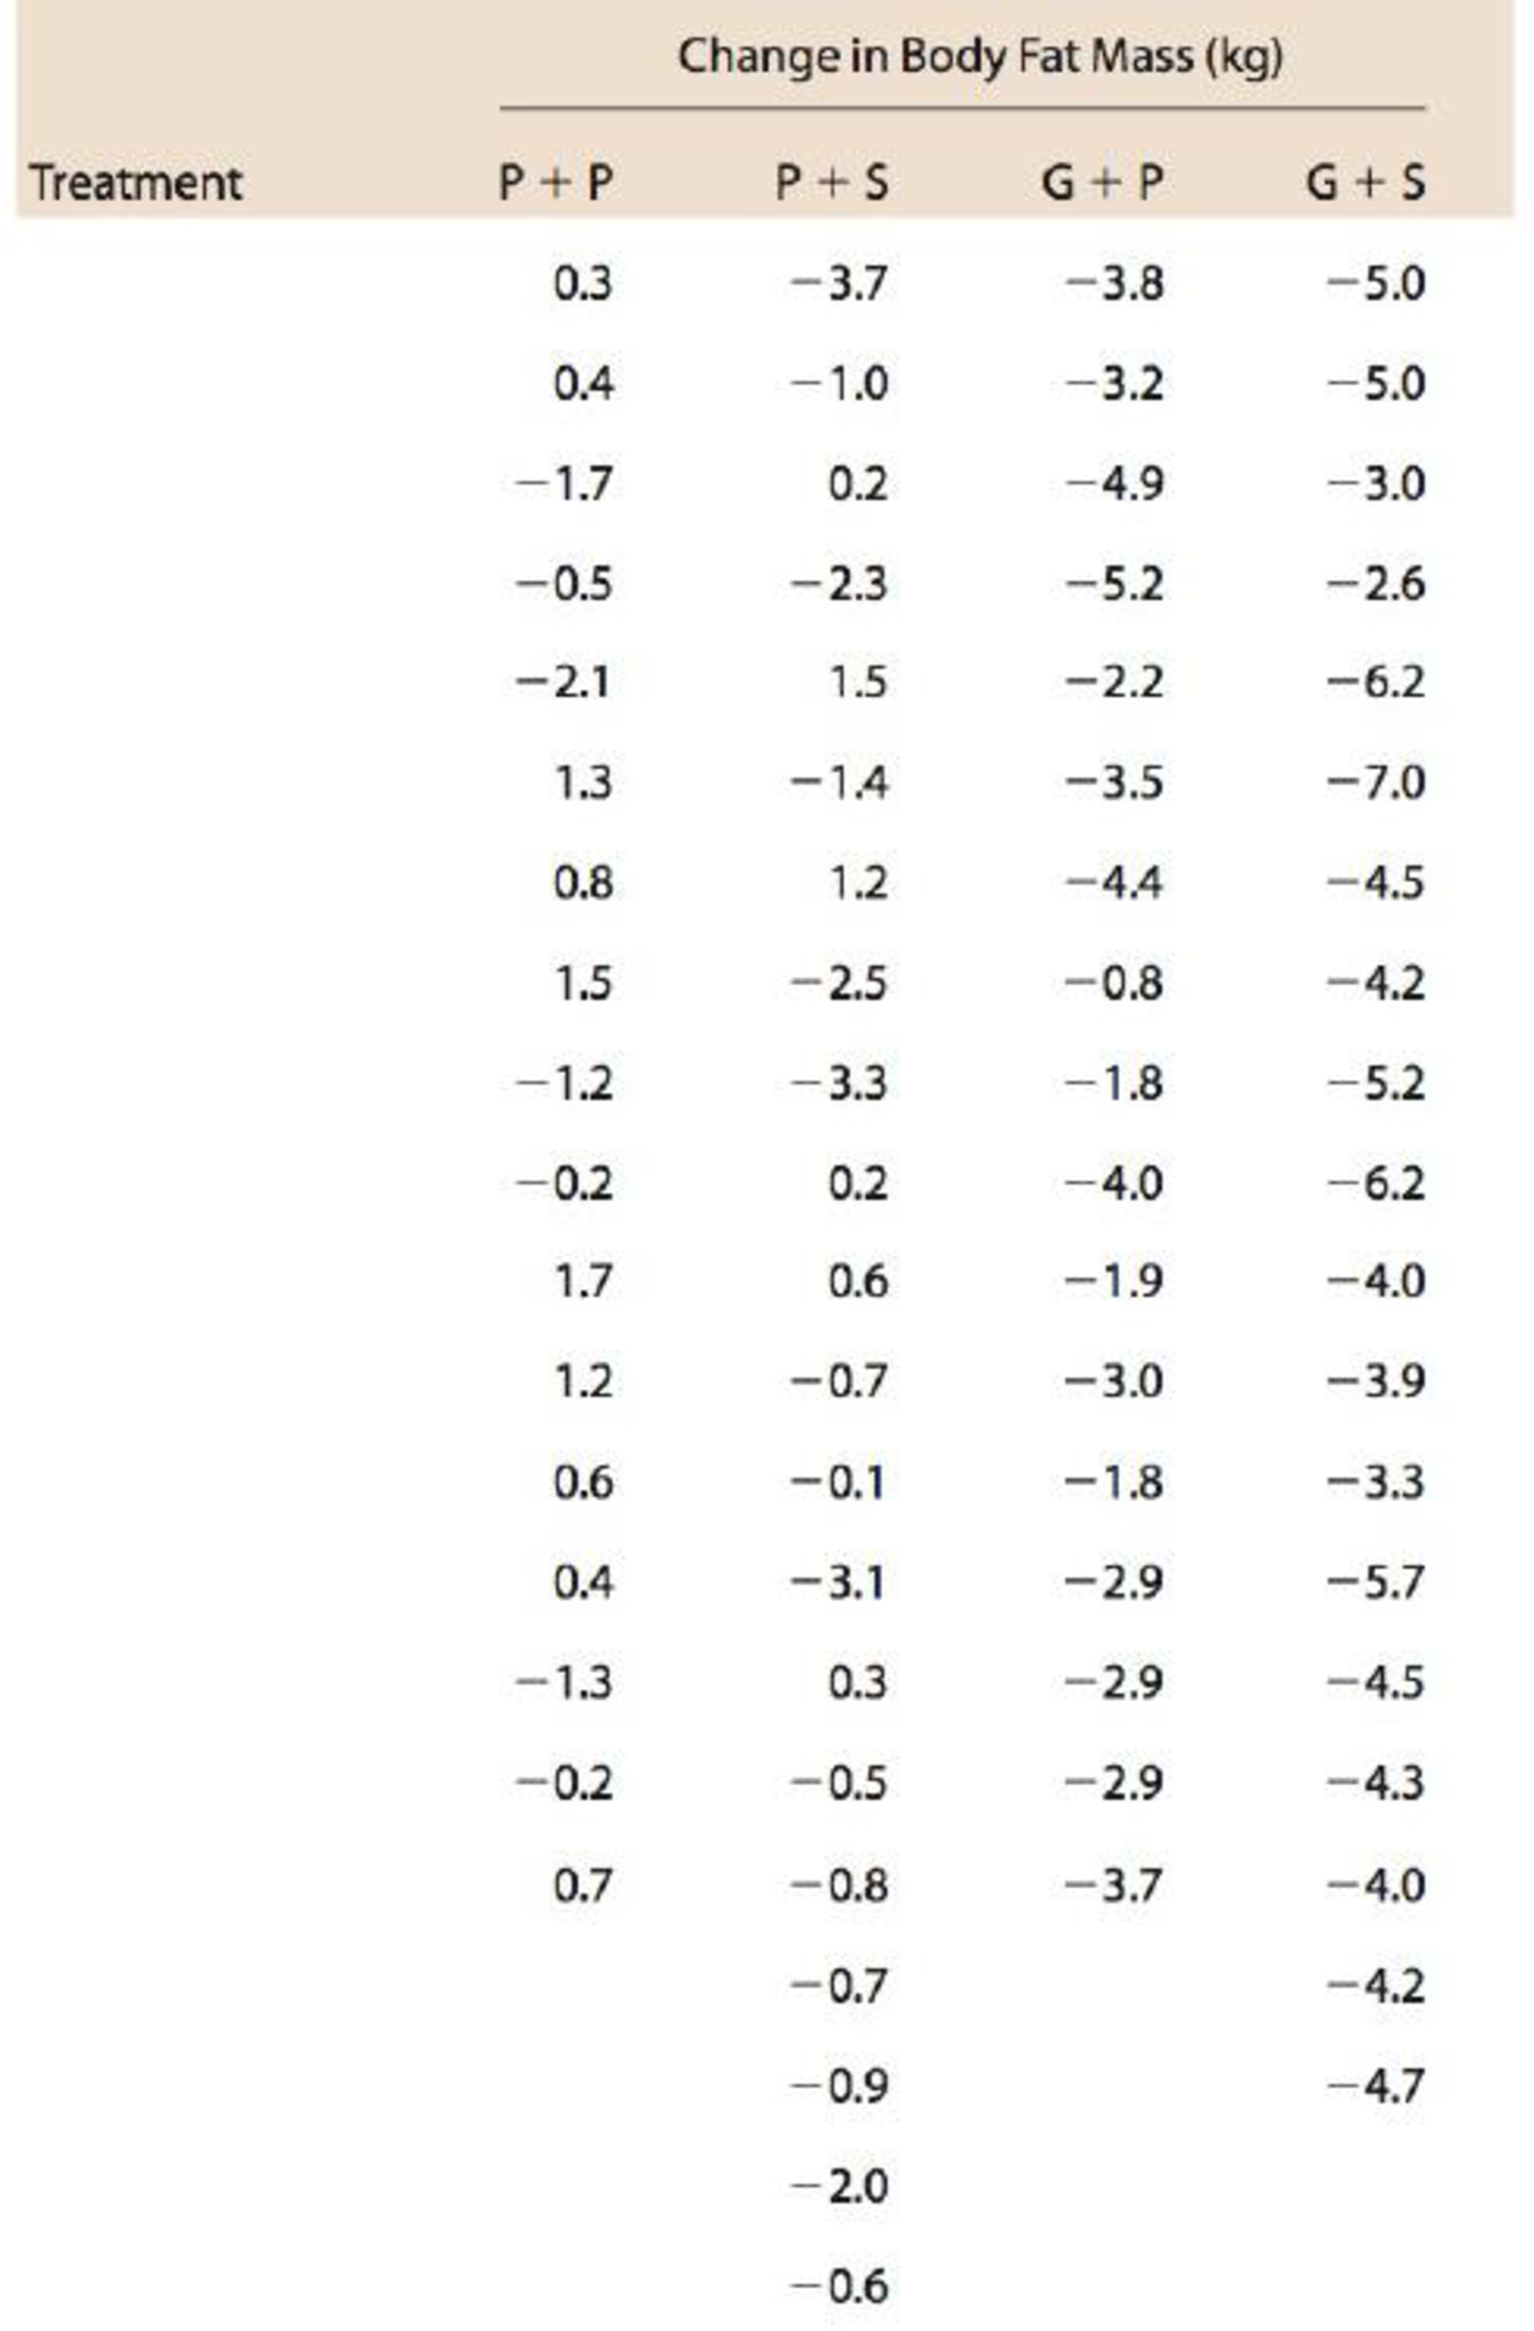
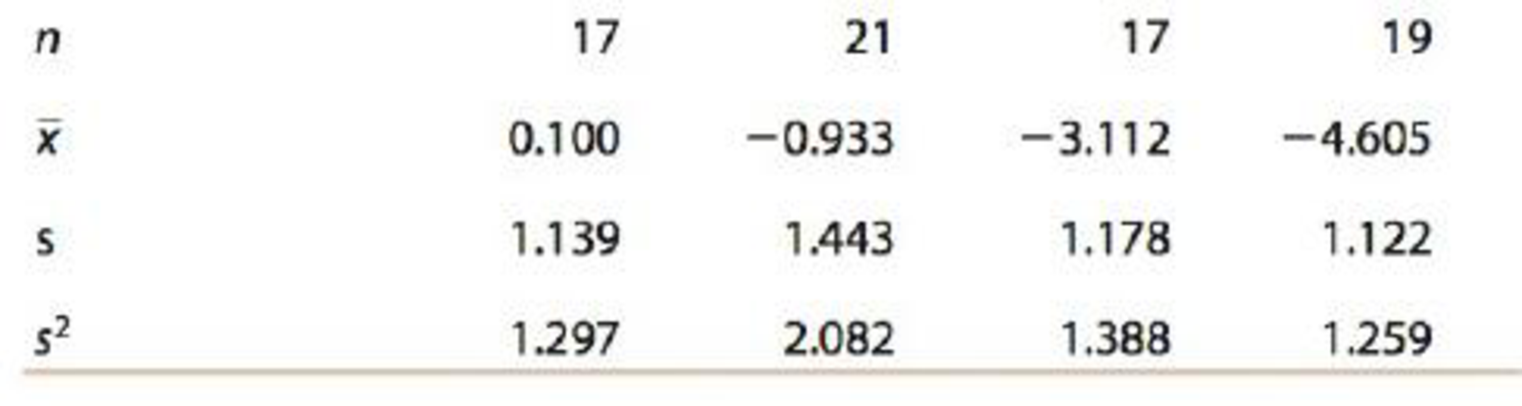
Also, N = 74, grand total = ‒158.3, and
Carry out an F test to determine if mean change in body fat mass differs for the four treatments.
Want to see the full answer?
Check out a sample textbook solution
Chapter 15 Solutions
Introduction to Statistics and Data Analysis


- What is an experiment?arrow_forwardResearchers have noted a decline in cognitive functioning as people age (Bartus, 1990). However, the results from other research suggest that the antioxidants in foods such as blueberries may reduce and even reverse these age-related declines (Joseph et al., 1999). To examine this phenomenon, suppose that a researcher obtains a sample of n = 16 adults who are between the ages of 65 and 75. The researcher uses a standardized test to measure cognitive performance for each individual. The participants then begin a 2-month program in which they receive daily doses of a blueberry supplement. At the end of the 2-month period, the researcher again measures cognitive performance for each participant. The results show an average increase in performance of Mp = 7.4 with SS = 1215. a. Does this result support the conclusion that the antioxidant supplement has a significant effect on cognitive performance? Use a two-tailed test with a = = .05. (1) Ho: (Select] ( Select ] [ Select ] H: ( Select ] […arrow_forwardResearchers have noted a decline in cognitive functioning as people age (Bartus, 1990). However, the results from other research suggest that the antioxidants in foods such as blueberries may reduce and even reverse these age-related declines (Joseph et al., 1999). To examine this phenomenon, suppose that a researcher obtains a sample of n = 16 adults who are between the ages of 65 and 75. The researcher uses a standardized test to measure cognitive performance for each individual. The participants then begin a 2-month program in which they receive daily doses of a blueberry supplement. At the end of the 2-month period, the researcher again measures cognitive performance for each participant. The results show an average increase in performance of MD = 7.4 with SS = 1215. Does this result support the conclusion that the antioxidant supplement has a significant effect on cognitive performance? Use a two-tailed test with α = .05. Show your computations.arrow_forward
- 2. 90 male volunteers are randomly assigned to three different treatment programs designed to produce a weight loss by focusing on either diet, exercise, or the modification of eating behaviour. Weight changes were recorded, to the nearest pound, for all participants who completed the two-month experiment. Positive scores signify a weight drop; negative scores, a weight gain (in kg). Diet Exercise Modification of eating behaviour 9.07 -0.15 7.44 2.12 -4.98 8.53 6.65 8.31 10.48 9.14 -9.99 -9.08 8.03 -9.96 4.62 -1.09 0.18 5.33 9.03 11.04 -7.84 12.03 12.04 9.89 8.43 10.12 9.00 10.51 7.17 7.55 0.15 2.18 8.63 8.91 6.38 6.70 8.63 10.86 12.30 11.02 14.44 8.94 6.07 0.43 2.70 0.11 11.16 9.03 9.99 -5.05 9.86 11.73 11.42 8.49 10.05 10.40 2.52 0.68 1.39 -2.19 9.13 10.31 6.83 12.68 9.43 10.24 11.42 11.97 9.98 -9.11 -1.28 4.51 -4.10 -0.98 | 12.03 9.67 8.67 5.93 4.58 3.39 -3.02 0.48 | 9.10 9.52 8.75 10.61 2.22 0.13 11.33 11.76 a. Develop a box-plot graph for the above data. Write the interpretation…arrow_forwardIn an experiment on immunization of cattle from tuberculosis, the following results were obtained: Affected Unaffected Inoculated 12. 28Not Inoculated 13 7Examine the effect of vaccine in controlling the incidence of the disease.arrow_forwardA clinical trial is run to assess the effects of different forms of regular exercise on HDL levels in persons between the ages of 19 and 29. Participants in the study are randomly assigned to one of three exercise groups—weight training, aerobic exercise, or stretching/yoga—and instructed to follow the program for 8 weeks. Their HDL levels are measured after 9 weeks and are summarized below. Exercise Group N Mean Std Dev Weight Training 20 49.7 10.2 Aerobic Exercise 20 43.1 11.1 Stretching/Yoga 20 57.0 12.5 Complete the following ANOVA table. Source of Error Sums of Squares df Mean Squares F Between Within 6157.32 Total 1.Write the hypotheses to be tested. 2. Write the decision rule. Please find the F for the closest df 3. What is the conclusion?arrow_forward
- Vasectomies and Prostate Cancer. In the United States, approximately 450,000 vasectomies are performed each year. In this surgical procedure for contraception, the tube carrying sperm from the testicles is cut and tied. Several studies have been conducted to analyze the relationship between vasectomies and prostate cancer. The results of one such study by E. Giovannucci et al. appeared in the paper “A Retrospective Cohort Study of Vasectomy and Prostate Cancer in U.S. Men” (Journal of the American Medical Association, Vol. 269(7), pp. 878–882). Of 21,300 men who had not had a vasectomy, 69 were found to have prostate cancer; of 22,000 men who had had a vasectomy, 113 were found to have prostate cancer. a. At the 1% significance level, do the data provide sufficient evidence to conclude that men who have had a vasectomy are at greater risk of having prostate cancer? Consider men who had had a vasectomy Population 2. b. Is this study a designed experiment or an observational study?…arrow_forwardA study was made of 1,057 cases of poisoning in children treated as inpatients at Milwaukee Children's Hospital from 1962 through 1968. Data on date of occurrence, age and sex of the child, and type of agent involved were recorded and analyzed by standard statistical methods. Poisoning was due to ingestion of aspirin in 35 per cent of the children studied and to the ingestion of hydrocarbon distillates in 18 per cent. A statistically significant male dominance was found for ingestion of hydrocarbons; age-specific peaks were found for some categories. Trends as to the relative and absolute frequencies of each specific poison from one year to the next were noted; possible reasons for increasing or decreasing trends are discussed. Is this study descriptive or inferential? Explain your answer. What are the variables used in the study? In your opinion, what level of measurement was used to obtain the data from the variables? Does the article define the population? If so, how is it…arrow_forwardThe article “Factors Associated with Exercise Behavior in People with Parkinson Disease” (T. Ellis, J. Cavanaugh, et al., Physical Therapy, 2011:1838–1848) reported a survey of patients with Parkinson's disease. Of 164 patients who said they exercised regularly, 76 reported falling in the previous six months. Of 96 patients who said they did not exercise regularly, 48 reported falling in the previous six months. Can you conclude that the proportion of patients who fall is less for those who exercise than for those who do not?arrow_forward
- Colonoscopy is a medical procedure that is designed to find and remove precancerous lesions in the colon before they become cancerous. The article “Association of Colonoscopy and Death from Colorectal Cancer” (N. Baxter, M. Goldwasser, et al., Annals of Internal Medicine, 2009:1–8) reports that in a sample of 10,292 people diagnosed with colorectal cancer, 7.0% had previously had a colonoscopy, and in a sample of 51,460 people without colorectal cancer, 9.8% had previously had a colonoscopy. Can you conclude that the percentage of people who have had colonoscopies is greater in those without colorectal cancer?arrow_forwardIn its January 25, 2012, issue, the Journal of the American Medical Association reported on the effects of overconsumption of low, normal, and high protein diets on weight gain, energy expenditure, and body composition. Researchers conducted a single blind, randomized controlled trial of 25 U.S. adults. The subjects were healthy, weight-stable, male and female volunteers, aged 18 to 35 years. All subjects consumed a weight-stabilizing diet for 13 to 25 days. Afterwards, the researchers randomly assigned participants to diets containing various percentages of energy from protein: 5% (low protein), 15% (normal protein), or 25% (high protein). The subjects were not aware of the specific protein level diet to which they were assigned. On these diets the researchers overfed the participants during the last 8 weeks of their 10 to 12 week stay in the inpatient metabolic unit. The goal was to investigate the effect of overconsumption of protein on weight gain, energy expenditure, and body…arrow_forwardAspirin and Cardiovascular Disease. In the article by P. Ridker et al. titled “A Randomized Trial of Low-dose Aspirin in the Primary Prevention of Cardiovascular Disease inWomen” (New England Journal of Medicine, Vol. 352, pp. 1293–1304), the researchers noted that “We randomly assigned 39,876 initially healthy women 45 years of age or older to receive 100 mg of aspirin or placebo on alternate days and then monitored them for 10 years for a first major cardiovascular event (i.e., nonfatal myocardial infarction, nonfatal stroke, or death from cardiovascular causes).”arrow_forward
 Holt Mcdougal Larson Pre-algebra: Student Edition...AlgebraISBN:9780547587776Author:HOLT MCDOUGALPublisher:HOLT MCDOUGAL
 Glencoe Algebra 1, Student Edition, 9780079039897...AlgebraISBN:9780079039897Author:CarterPublisher:McGraw Hill