
a.
Find the estimated regression equation that could be used to predict the average number of runs given up per inning given the average number of strikeouts per innings pitched.
a.
Answer to Problem 10E
The estimated regression equation that could be used to predict the average number of runs given up per inning given the average number of strikeouts per innings pitched is
Explanation of Solution
Calculation:
The Major League Baseball (MLB) data for the season 2011consists of the average number of earned runs given up by the pitcher per nine innings (ERA), the average number of strikeouts per innings pitched (SO/IP), the average number of home runs per innings pitched (HR/IP) and the number of runs given up per innings pitched (R/IP).
Multiple linear regression model:
A multiple linear regression model is given as
Regression:
Software procedure:
Step by step procedure to get regression equation using MINITAB software is given as,
- Choose Stat > Regression > Regression > Fit Regression Model.
- Under Responses, enter the column of R/IP.
- Under Continuous predictors, enter the columns ofSO/IP.
- Click OK.
The output using MINITAB software is given as,
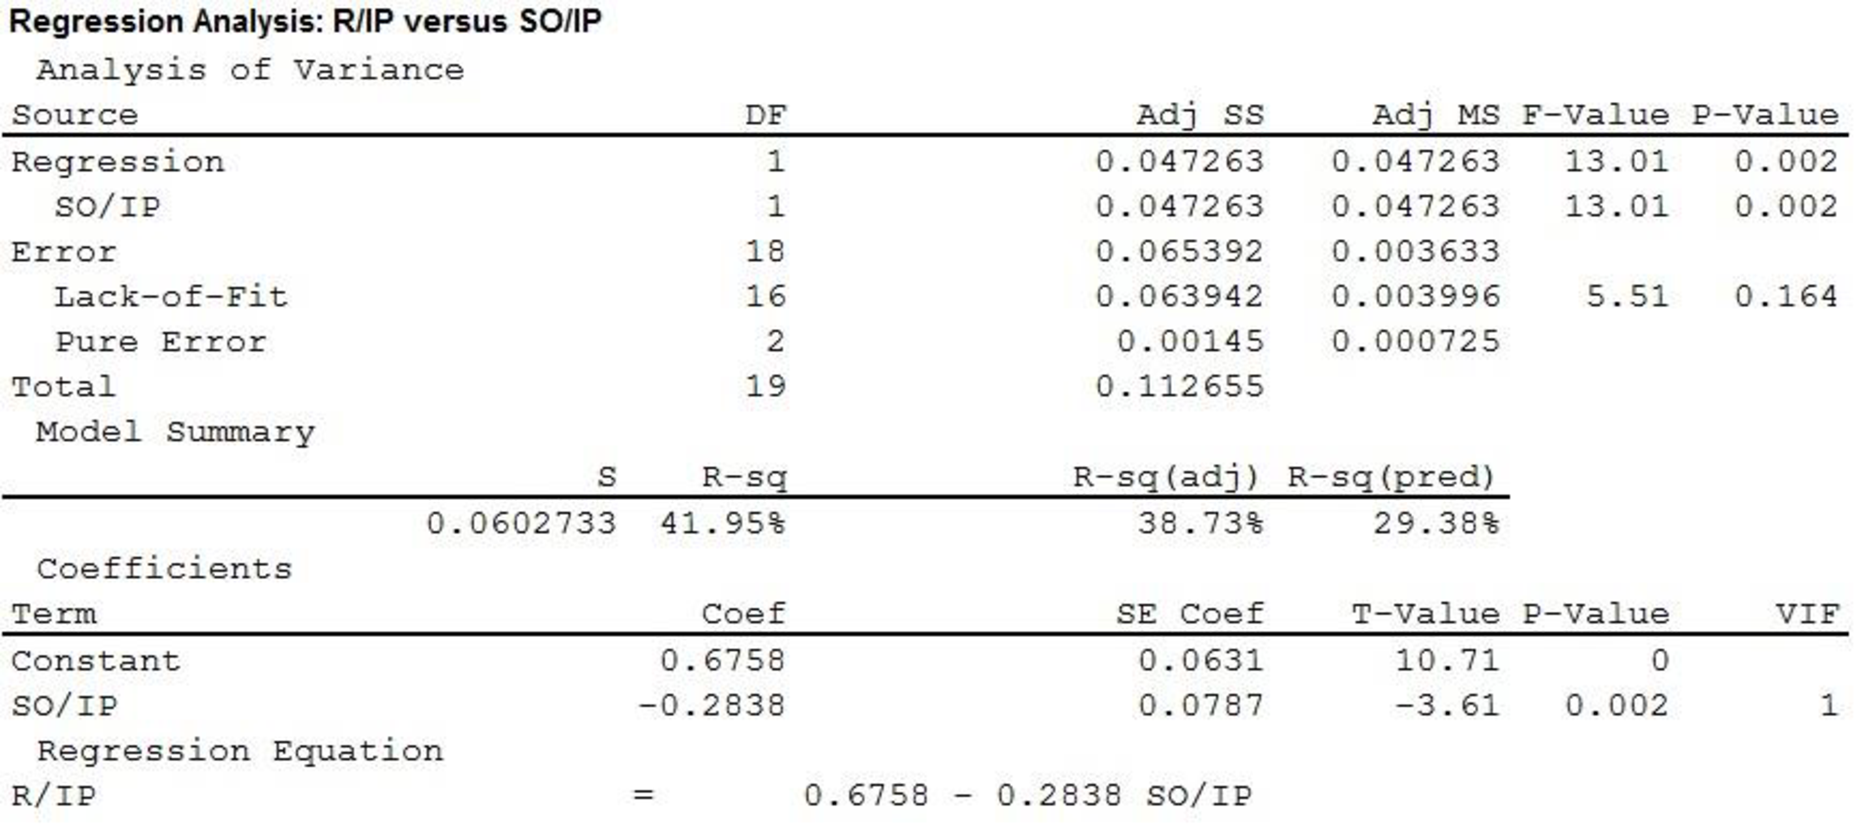
Thus, the estimated regression equation that could be used to predict the average number of runs given up per inning given the average number of strikeouts per innings pitched is
b.
Find the estimated regression equation that could be used to predict the average number of runs given the average number of home runs per innings pitched.
b.
Answer to Problem 10E
The estimated regression equation that could be used to predict the average number of runs given the average number of home runs per innings pitched is
Explanation of Solution
Calculation:
Regression:
Software procedure:
Step by step procedure to get regression equation using MINITAB software is given as,
- Choose Stat > Regression > Regression > Fit Regression Model.
- Under Responses, enter the column of R/IP.
- Under Continuous predictors, enter the column ofHR/IP.
- Click OK.
The output using MINITAB software is given as,
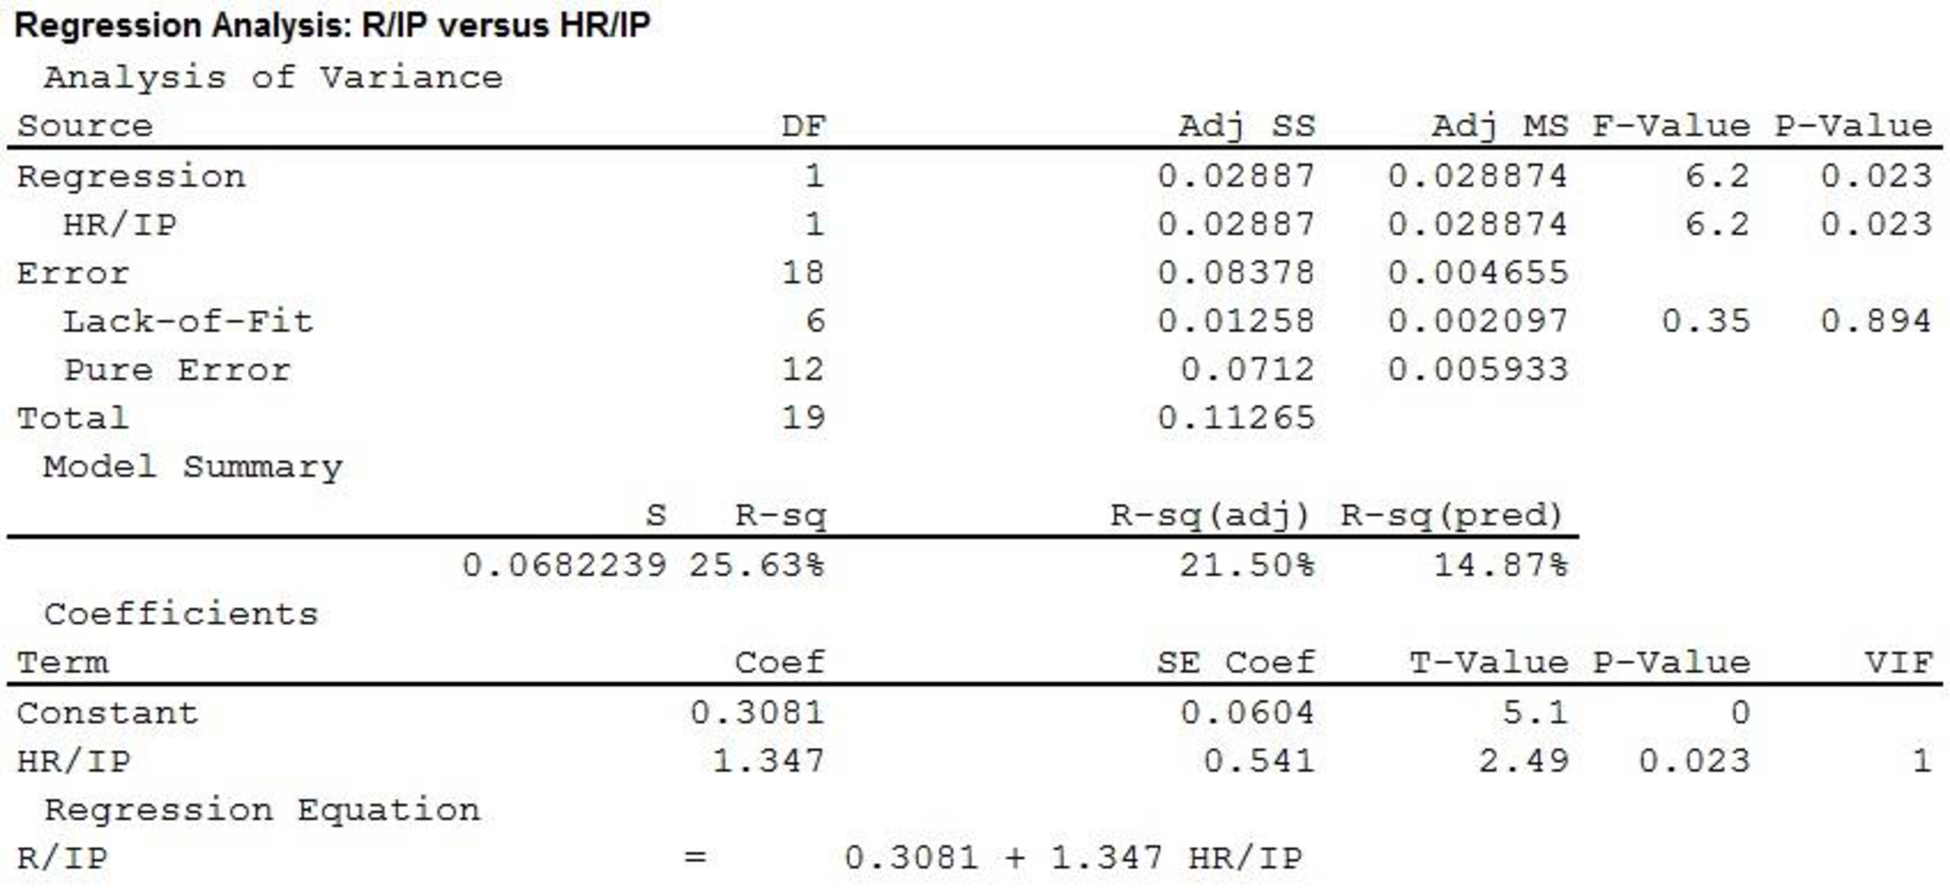
Thus, the estimated regression equation that could be used to predict the average number of runs given the average number of home runs per innings pitched is
c.
Find the estimated regression equation that could be used to predict the average number of runs given the average number of strikeouts per innings pitched and the average number of home runs per innings pitched.
c.
Answer to Problem 10E
The estimated regression equation that could be used to predict the average number of runs given the average number of strikeouts per innings pitched and the average number of home runs per innings pitched is
Explanation of Solution
Calculation:
Regression:
Software procedure:
Step by step procedure to get regression equation using MINITAB software is given as,
- Choose Stat > Regression > Regression > Fit Regression Model.
- Under Responses, enter the column of R/IP.
- Under Continuous predictors, enter the columns ofSO/IP andHR/IP.
- Click OK.
The output using MINITAB software is given as,
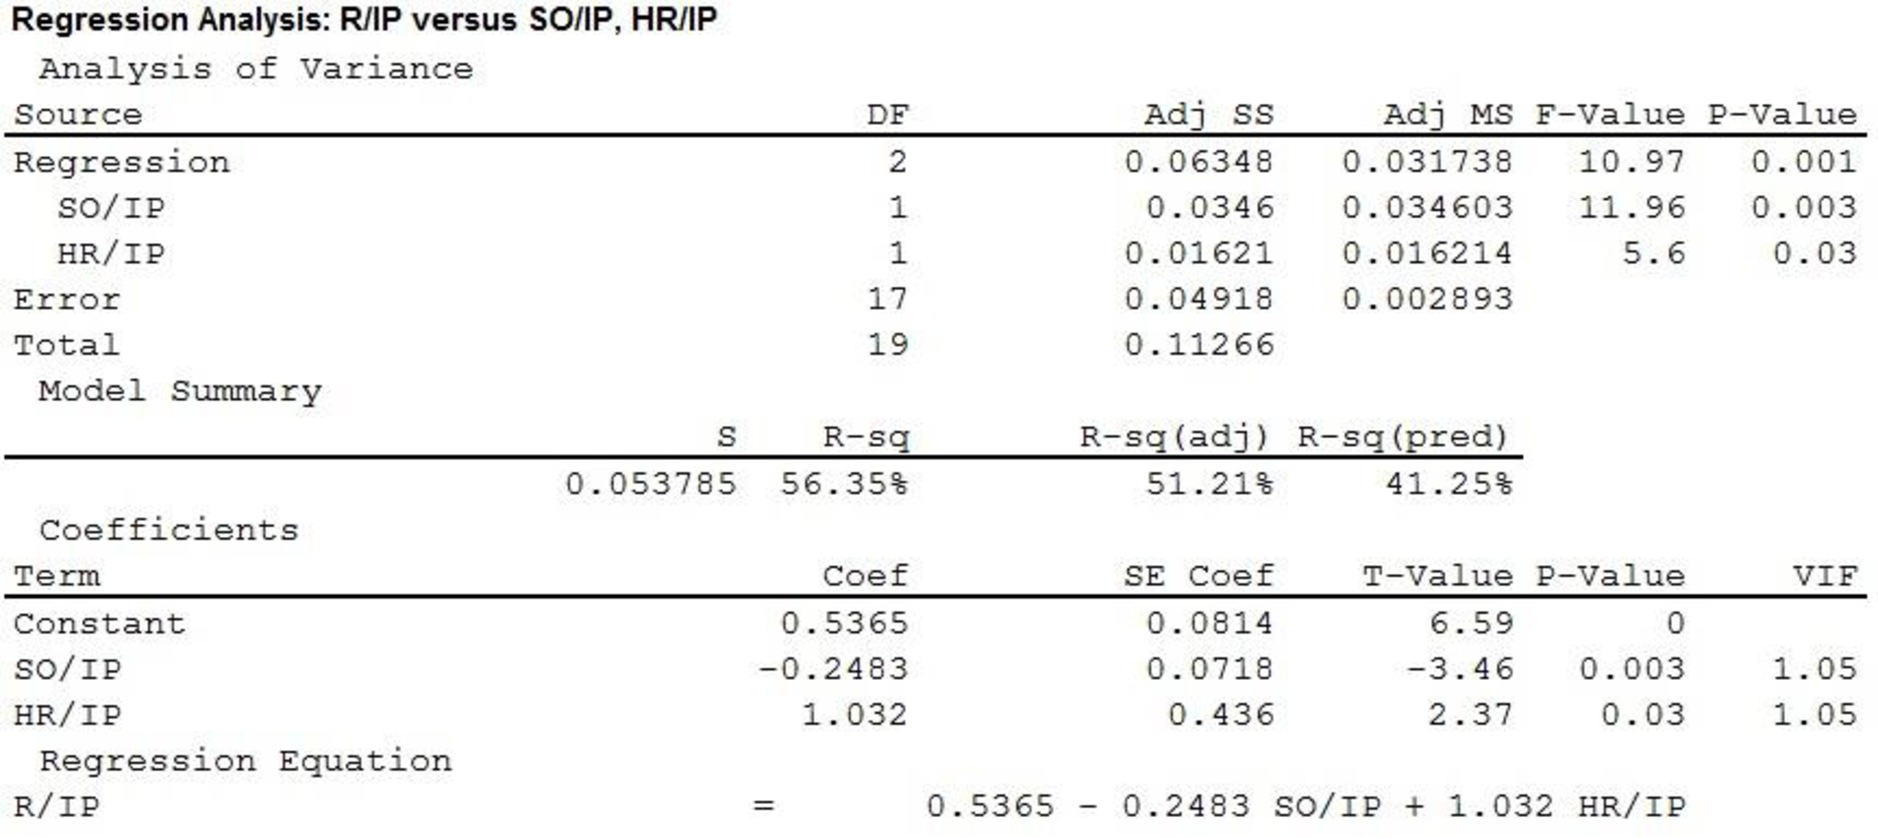
Thus, the estimated regression equation that could be used to predict the average number of runs given the average number of strikeouts per innings pitched and the average number of home runs per innings pitched is
d.
Predict the average number of runs given up per inning for A.J. Burnett using the regression equation of part c.
d.
Answer to Problem 10E
The predicted average number of runs given up per inning for A.J. Burnett is 0.4757.
Explanation of Solution
Calculation:
The average number of strikeouts and the average number of home runs per innings pitched for A.J. Burnet are 0.91 and 0.16, respectively.
From part (c), it is found that estimated regression equation that could be used to predict the average number of runs given the average number of strikeouts per innings pitched and the average number of home runs per innings pitched is
Thus, using the given information the predicted average number of runs given up per inning for A.J. Burnett is,
Thus, the predicted average number of runs given up per inning for A.J. Burnett is 0.4757.
It is to be noted that the actual average number of runs given up per inning for A.J. Burnett was 0.6.
Thus, the predicted value is slightly less than the actual value. Hence, the residual is positive, which underestimate the model slightly.
e.
Explain about the suggestion to use the earned run average as another independent variable.
e.
Explanation of Solution
Calculation:
Software procedure:
Step by step procedure to get correlation coefficient using MINITAB software is given as,
- Choose Stat > Basic Statistics > Correlation.
- Under Variables, enter the column of R/IP and ERA.
- Click OK.
The MINITAB output is given as,
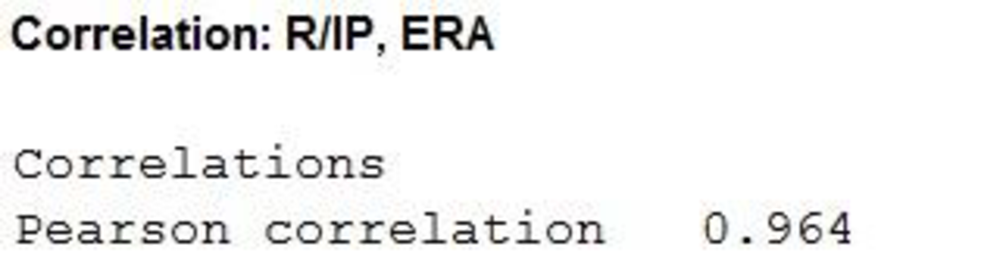
Thus, the correlation coefficient between R/IO and ERA is 0.964.
Due to the high correlation coefficient, it can be said that if a pitcher gives up more runs per innings pitched then pitcher’s run average also increase. Thus, automatically there will be high value of coefficient of determination in the
Thus, the suggestion does not make any sense.
In addition, the ERA can be used as the predictor dependent variable.
Want to see more full solutions like this?
Chapter 15 Solutions
EBK STATISTICS FOR BUSINESS & ECONOMICS

- Name the four characteristics of a good definition.arrow_forwardMajor League Baseball (MLB) consists of teams that play in the American League and the National League. MLB collects a wide variety of team and player statistics. Some of the statistics often used to evaluate pitching performance are as follows: • ERA: The average number of earned runs given up by the pitcher per nine innings. An earned run is any run that the opponent scores off a particular pitcher except for runs scored as a result of errors. • SO/IP: The average number of strikeouts per inning pitched. • HR/IP: The average number of home runs per inning pitched. • R/IP: The number of runs given up per inning pitched. The following data show values for these statistics for a random sample of 20 pitchers from the American League for one full season. Player Тeam W ERA SO/IP HR/IP R/IP Verlander, J DET 24 2.40 1.00 0.09 0.29 Beckett, J BOS 13 7 2.88 0.92 0.12 0.35 Wilson, C TEX 16 7 2.93 0.93 0.08 0.40 Sabathia, C ΝY 19 8. 3.01 0.97 0.06 0.36 Haren, D LAA 16 10 3.16 0.80 0.08 0.37…arrow_forwardThis data came from ESPN.com. Listed here are the batting averages of 20 of the top 100 batters in 2014 by WAR (wins above replacement). 0.287 0.255 0.324 0.327 0.301 0.341 0.293 0.263 0.268 0.281 0.315 0.335 0.311 0.300 0.242 0.273 0.284 0.271 0.274 0.300 Include appropriate titles and labels as you complete the following: Construct a grouped frequency distribution for the data using six classes. Use the grouped frequency data for the rest of the project. Construct a frequency polygon for the data. Construct an ogive for the data.arrow_forward
- 1. Calculate the batting runs for the top five home run hitters of all time, for the season in which each won his first Most Valuable Player Award: Hank Aaron in 1957, Barry Bonds in 1991, Babe Ruth in 1923, Willie Mays in 1954, and Sammy Sosa in 1998. Who contributed the most wins to his own team? Here is the data: Player Year AB 2B 3B HR BB HBP SB CS Aaron 1957 615 198 27 6. 44 57 Bonds 1990 519 156 32 3 33 93 3. 52 13 565 8. Mayi Ruth 1954 195 33 13 41 66 12 1923 522 205 45 13 41 170 4. 17 21 Sosa 1998 643 198 20 66 73 1 18 9arrow_forwardThe following are average points per game for players on the LA Lakers and Miami Heat during the 2019-2020 season: Lakers (20 values): 0, 1.4, 1.5, 2.8, 4.2, 5.1, 5.3, 5.5, 5.7, 6, 6.6, 7.1, 7.5, 8, 8.6, 9.3, 11.9, 12.8, 25.3, 26.1 Heat (21 values): 0.8, 1, 1.4, 2.4, 3, 3, 4.5, 4.6, 5.7, 6.1, 8.2, 8.5, 9.3, 11.3, 11.9, 13.5, 13.5, 15.3, 15.9, 16.2, 19.9 a) Calculate the five-number summary of each. b) Draw boxplots of each. c) Compare the boxplots – how do they differ?arrow_forward
 Glencoe Algebra 1, Student Edition, 9780079039897...AlgebraISBN:9780079039897Author:CarterPublisher:McGraw Hill
 Holt Mcdougal Larson Pre-algebra: Student Edition...AlgebraISBN:9780547587776Author:HOLT MCDOUGALPublisher:HOLT MCDOUGAL
 Algebra & Trigonometry with Analytic GeometryAlgebraISBN:9781133382119Author:SwokowskiPublisher:Cengage
 Big Ideas Math A Bridge To Success Algebra 1: Stu...AlgebraISBN:9781680331141Author:HOUGHTON MIFFLIN HARCOURTPublisher:Houghton Mifflin Harcourt
 Algebra: Structure And Method, Book 1AlgebraISBN:9780395977224Author:Richard G. Brown, Mary P. Dolciani, Robert H. Sorgenfrey, William L. ColePublisher:McDougal Littell
 Elementary Geometry For College Students, 7eGeometryISBN:9781337614085Author:Alexander, Daniel C.; Koeberlein, Geralyn M.Publisher:Cengage,