
Statistics for Business and Economics (13th Edition)
13th Edition
ISBN: 9780134506593
Author: James T. McClave, P. George Benson, Terry Sincich
Publisher: PEARSON
expand_more
expand_more
format_list_bulleted
Concept explainers
Videos
Textbook Question
Chapter 15.2, Problem 15.13ACI
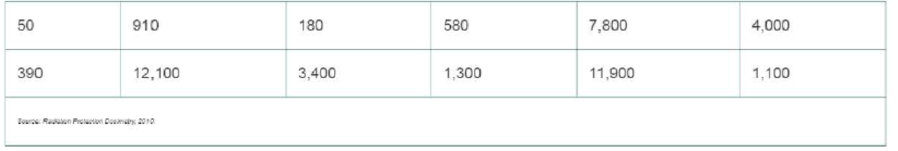
Radon exposure in Egyptian tombs. Refer to the Radiation Protection Dosimetry (December 2010) study of radon exposure in Egyptian tombs, Exercise 7.55 (p. 393). The radon levels–measured in becquerels per cubic meter (Bq/m3) –in the inner chambers of a sample of 12 tombs are reproduced in the table below. Recall that for safety purposes, the Egypt Tourism Authority (ETA) temporarily closes the tombs if the level of radon exposure in the tombs rises too high, say, 6,000 Bq/m3. Conduct a non parametric test to determine if the true median level of radon exposure in the tombs is less than 6,000 Bq/m3. Use α = .10. Should the tombs be closed?
Expert Solution & Answer
Want to see the full answer?
Check out a sample textbook solution
Students have asked these similar questions
A study was conducted to examine if children with autism spectrum disorder (ASD) had higher prenatal exposure to air pollution, specifically particulate matter < 2.5 g in diameter (PM2.5). Researchers obtained birth records of all children born in Los Angeles between 2000 and 2008 and linked these to the Department of Developmental Services records to determine if any of those subjects had been diagnosed with ASD or not. They used the birth addresses given in the birth records to determine the average daily PM2.5 for the third trimester for each child. The standard deviation for PM2.5 among ASD subjects was found to be 34.6 and for non-ASD subjects was 16.8. Assume PM2.5 is normally distributed.
4a. What was the study design?
* Randomized Clinical Trial (RCT)
* Case Report
* Nested Case-Control Study
* Case-Control Study
* cross-sectional study
Cohort Study
4B. What are the null and alternative hypotheses?
4c. What type of statistical test would you use to analyze the…
Researchers interested in lead exposure due to car exhaust sampled the blood of 52 police officers subjected to constant inhalation of automobile exhaust fumes while working traffic enforcement in a primarily urban environment. The blood samples of these officers had an average lead concentration of 124.32 µg/l and an SD of 37.74 µg/l; a previous study of individuals from a nearby suburb, with no history of exposure, found an average blood level concentration of 35 µg/l.
Write down the hypotheses that would be appropriate for testing if the police officers appear to have been exposed to a higher concentration of lead.
Explicitly state and check all conditions necessary for inference on these data.
Test the hypothesis that the downtown police officers have a higher lead exposure than the group in the previous study. Interpret your results in context.
Based on your preceding result, without performing a calculation, would a 99% confidence interval for the average blood concentration…
A study of college students in the city of Pemblington found that 8% had been victims of violent crimes.
a) statistics
b) parameter
Chapter 15 Solutions
Statistics for Business and Economics (13th Edition)
Ch. 15.2 - Under what circumstances is the sign test...Ch. 15.2 - What is the probability that a randomly selected...Ch. 15.2 - Use Table I of Appendix D to calculate the...Ch. 15.2 - Consider the following sample of 10 measurements....Ch. 15.2 - Suppose you wish to conduct a test of the research...Ch. 15.2 - Accidents at construction sites. Refer to the...Ch. 15.2 - Salaries of experienced MBA graduates. According...Ch. 15.2 - Caffeine in Starbucks coffee. Researchers at the...Ch. 15.2 - Short-sale stock returns. The Securities and...Ch. 15.2 - Lobster trap placement. Refer to the Bulletin of...
Ch. 15.2 - Repair and replacement costs of water pipes. Refer...Ch. 15.2 - Performance of stock screeners. Refer to Exercise...Ch. 15.2 - Radon exposure in Egyptian tombs. Refer to the...Ch. 15.2 - Prob. 15.14ACICh. 15.3 - Prob. 15.15LMCh. 15.3 - Specify the test statistic and the rejection...Ch. 15.3 - Prob. 15.17LMCh. 15.3 - Prob. 15.18LMCh. 15.3 - Prob. 15.19ACBCh. 15.3 - Prob. 15.21ACBCh. 15.3 - Prob. 15.22ACBCh. 15.3 - The X-Factor in golf performance. Many golf...Ch. 15.3 - Prob. 15.24ACICh. 15.3 - Prob. 15.25ACICh. 15.3 - Prob. 15.26ACICh. 15.3 - Does rudeness really matter in the workplace?...Ch. 15.3 - Prob. 15.28ACICh. 15.4 - Prob. 15.29LMCh. 15.4 - Prob. 15.30LMCh. 15.4 - Prob. 15.31LMCh. 15.4 - Prob. 15.32LMCh. 15.4 - Twinned drill holes. Refer to the Exploration and...Ch. 15.4 - Prob. 15.34ACBCh. 15.4 - Prob. 15.35ACBCh. 15.4 - Prob. 15.36ACBCh. 15.4 - Prob. 15.37ACBCh. 15.4 - Prob. 15.38ACICh. 15.4 - Prob. 15.39ACICh. 15.4 - Prob. 15.40ACICh. 15.4 - Prob. 15.41ACICh. 15.4 - Prob. 15.42ACICh. 15.5 - Under what circumstances does the 2 distribution...Ch. 15.5 - Data were collected from three populations, A, B....Ch. 15.5 - Prob. 15.45LMCh. 15.5 - Prob. 15.46ACBCh. 15.5 - Prob. 15.47ACBCh. 15.5 - Prob. 15.48ACBCh. 15.5 - Prob. 15.49ACBCh. 15.5 - Prob. 15.50ACICh. 15.5 - Public defenders salaries. Random samples of seven...Ch. 15.5 - Prob. 15.52ACICh. 15.5 - Prob. 15.53ACICh. 15.6 - Prob. 15.54LMCh. 15.6 - Prob. 15.55LMCh. 15.6 - Prob. 15.56LMCh. 15.6 - Prob. 15.57ACBCh. 15.6 - Condit ions impeding farm production. A review of...Ch. 15.6 - Peer mentor training at a firm. Refer to the...Ch. 15.6 - Prob. 15.60ACBCh. 15.6 - Prob. 15.61ACICh. 15.6 - Prob. 15.62ACICh. 15.6 - Prob. 15.63ACICh. 15.6 - Prob. 15.64ACICh. 15.6 - Prob. 15.65ACICh. 15.7 - Prob. 15.66LMCh. 15.7 - Prob. 15.67LMCh. 15.7 - The following sample data were collected on...Ch. 15.7 - Compute Spearman s rank correlation coefficient...Ch. 15.7 - Charisma of top-level leaders. Refer to the...Ch. 15.7 - Prob. 15.71ACBCh. 15.7 - Prob. 15.72ACBCh. 15.7 - Prob. 15.73ACBCh. 15.7 - Prob. 15.74ACICh. 15.7 - Prob. 15.75ACICh. 15.7 - Prob. 15.76ACICh. 15.7 - Prob. 15.77ACICh. 15.7 - Sweetness of orange juice Refer to the orange...Ch. 15.7 - Americas most reputable companies. Forbes magazine...Ch. 15 - The data for three independent random samples are...Ch. 15 - Prob. 15.81LMCh. 15 - Two independent random samples produced the...Ch. 15 - Prob. 15.83LMCh. 15 - Prob. 15.84ACBCh. 15 - Prob. 15.85ACBCh. 15 - Office rental growth rates Real estate market...Ch. 15 - RIF plan to fire older employees. Reducing the...Ch. 15 - Prob. 15.88ACBCh. 15 - Wine-tasting experiment. Two expert wine tasters...Ch. 15 - Employee suggestion system. An employee suggestion...Ch. 15 - Prob. 15.91ACICh. 15 - Prob. 15.92ACICh. 15 - Prob. 15.93ACICh. 15 - Prob. 15.94ACICh. 15 - Cooling method for gas turbines. Refer to the...Ch. 15 - Flexible working hours program. A job-scheduling...Ch. 15 - Fluoride in drinking water. Many water treatment...Ch. 15 - Does fatigue lead to more defectives? A...Ch. 15 - Prob. 15.99ACICh. 15 - Prob. 15.100ACICh. 15 - Prob. 15.101ACICh. 15 - Groundwater contamination of wells. Methyl...
Knowledge Booster


Learn more about
Need a deep-dive on the concept behind this application? Look no further. Learn more about this topic, statistics and related others by exploring similar questions and additional content below.Similar questions
- Listed below are amounts of strontium-90 (in millibecquerels, or mBq, per gram of calcium) in a simple random sample by baby teeth obtained from Pennsylvania residents and New York residents born after 1979. Use a 0.05 significance level and Wilcoxon rank-sum test to test the claim that the median amount of strontium-90 from Pennsylvania residents is the same as the median from New York residents. Pennsylvania 155 142 149 130 151 163 151 142 156 133 138 161 New York 133 140 142 131 134 129 128 140 140 140 137 143 1. what is the exact value of R = R 1 (Pennsylvania)? (Round off to 1 decimal place.) 2. what is the value of μ R ? (Type as a whole number.) 3. what is the value of σ R ? (Round off to 2 decimal places.) 4. what is the computed value of z ? (Round off to 2 decimal places.) 5. what is the tabular value of z ? (Round off to 2 decimal places.arrow_forwardIn a study examining overweight and obese college football players, Mathews and Wagner(2008) found that on average both offensive and defensive linemen exceeded the at-risk criterionfor body mass index (BMI). BMI is a ratio of body weight to height squared and is commonlyused to classify people as overweight or obese. Any value greater than 30 kg/m2 is considered tobe at risk. In the study, a sample of n = 17 offensive linemen averaged M = 34.4 with a standarddeviation of s = 4.0. A sample of n = 19 defensive linemen averaged M = 31.9 with s = 3.5a. Use a single-sample t test to determine whether the offensive linemen are significantly abovethe at-risk criterion for BMI. Use a one-tailed test with α = .01.b. Use a single-sample t test to determine whether the defensive linemen are significantly abovethe at-risk criterion for BMI. Use a one-tailed test with α = .01.c. Use an independent-measures t test to determine whether there is a significant differencebetween the offensive linemen…arrow_forwardThe median pH level of the rain in a certain county, was 4.90. A biologist obtains a random sample of 19 rain dates and obtains the following data. Test the hypothesis that the median pH level has decreased from 4.90 at the alpha= 0.05 level of significance.arrow_forward
- To combat antibiotic resistance, the Quality Improvement Consortium recommends a throat swab to confirm strep throat before a physician prescribes antibiotics to children under age 5. Nationally, 40 percent of children under 5 who received antibiotics did not have a throat swab. The Colorado Department of Health took a random sample of 60 children under the age of 5 who received antibiotics for throat infections and found that 18 did not have a throat swab. At α = .05, is this a statistically significant reduction over last year’s national rate of 40 percent? (a-1) Calculate the critical value. (A negative value should be indicated by a minus sign. Round your answer to 3 decimal places.) Critical value _____ (a-2) Calculate the test statistic. (A negative value should be indicated by a minus sign. Round your answer to 2 decimal places.) Test statistic _____arrow_forwardTo combat antibiotic resistance, the Quality Improvement Consortium recommends a throat swab to confirm strep throat before a physician prescribes antibiotics to children under age 5. Nationally, 40 percent of children under 5 who received antibiotics did not have a throat swab. The Colorado Department of Health took a random sample of 100 children under the age of 5 who received antibiotics for throat infections and found that 30 did not have a throat swab. At α = .05, is this a statistically significant reduction over last year’s national rate of 40 percent? (a-1) Choose the correct null and alternative hypotheses. H0: π ≥ .40 vs. H1: π < .40 H0: π ≤ .40 vs. H1: π > .40 H0: π = .40 vs. H1: π ≠ .40 (a-2) Calculate the critical value. (A negative value should be indicated by a minus sign. Round your answer to 3 decimal places.) Critical value (a-3) Calculate the test statistic. (A negative value should be indicated by a minus sign. Round your…arrow_forwardThree samples of each of three types of PVC pipe of equal wall thickness are tested to failure under three temperature conditions, yielding the results shown below. Research questions: Is mean burst strength affected by temperature and/or by pipe type? Is there a “best” brand of PVC pipe? Burst Strength of PVC Pipes (psi) Temperature PVC1 PVC2 PVC3 Hot (70º C) 247 299 239 277 287 262 283 275 279 Warm (40º C) 325 341 297 322 319 315 296 335 304 Cool (10º C) 358 375 327 366 352 334 338 359 340 Click here for the Excel Data File (a-1) Choose the correct row-effect hypotheses. a. H0: A1 ≠ A2 ≠ A3 ≠ 0 ⇐⇐ Temperature means differ H1: All the Aj are equal to zero ⇐⇐ Temperature means are the same b. H0: A1 = A2 = A3 = 0 ⇐⇐ Temperature means are the same H1: Not all the Aj are equal to zero ⇐⇐ Temperature means differ a b (a-2) Choose the correct column-effect hypotheses. a. H0: B1 ≠ B2 ≠ B3 ≠ 0 ⇐⇐…arrow_forward
- Dr. Stevenson reported the following in a journal: “F (4, 106) = 10.09, p = .04.” Should Dr. Stevenson state that there are significant differences among the variable means at a .01 alpha level?arrow_forwardA researcher reports an F-ratio with dfbetween = 2 and dfwithin = 30 for an independent-measures ANOVA. a. How many treatment conditions were compared in the experiment? b. How many subjects participated ion the experiment?arrow_forwardDr. Romanoff reported the following in a journal: “F (5, 106) = 10.09, p = .04.” Should Dr. Romanoff state that there are significant differences among the variable means at a .05 alpha level?arrow_forward
- A paper gave summary quantities for blood lead level (in micrograms per deciliter) for a sample of whites and a sample of African Americans. Data consistent with the given summary quantities is given below. Whites (W) 8.3 0.9 2.9 5.6 5.8 5.4 1.2 1.0 1.4 2.1 1.3 5.3 8.4 6.6 5.2 3.4 2.9 2.7 6.7 3.6 African Americans (AA) 4.8 1.4 0.9 10.8 2.4 0.6 5.0 5.4 6.1 2.9 5.0 2.1 7.5 3.4 13.6 1.4 3.7 3.3 14.8 3.9 (a) Calculate the values of the mean and the median for blood lead level for the sample of African Americans. mean median (b) Which of the mean or the median is larger? What characteristic of the data set explains the relative values of the mean and the median? The median is greater than the mean. This is explained by the fact that the distribution is positively skewed. The mean is greater than the median. This is explained by the fact that the distribution is positively skewed. The median is greater than the mean. This is explained by the fact that the…arrow_forwardA paper gave summary quantities for blood lead level (in micrograms per deciliter) for a sample of whites and a sample of African Americans. Data consistent with the given summary quantities is given below. Whites (W) 8.3 0.9 2.9 5.6 5.8 5.4 1.2 1.0 1.4 2.1 1.3 5.3 8.4 6.6 5.2 3.6 2.9 2.7 6.7 3.8 African Americans (AA) 4.8 1.4 0.9 10.8 2.4 0.6 5.0 5.4 6.1 2.9 5.0 2.1 7.5 3.4 13.4 1.4 3.9 3.3 14.8 4.1 (a) Calculate the values of the mean and the median for blood lead level for the sample of African Americans. meanmedian (b) Which of the mean or the median is larger? What characteristic of the data set explains the relative values of the mean and the median? The mean is greater than the median. This is explained by the fact that the distribution is positively skewed.The median is greater than the mean. This is explained by the fact that the distribution is positively skewed. The median is greater than the mean. This is explained by the fact that the…arrow_forward
arrow_back_ios
arrow_forward_ios
Recommended textbooks for you
 Glencoe Algebra 1, Student Edition, 9780079039897...AlgebraISBN:9780079039897Author:CarterPublisher:McGraw Hill
Glencoe Algebra 1, Student Edition, 9780079039897...
Algebra
ISBN:9780079039897
Author:Carter
Publisher:McGraw Hill
Statistics 4.1 Point Estimators; Author: Dr. Jack L. Jackson II;https://www.youtube.com/watch?v=2MrI0J8XCEE;License: Standard YouTube License, CC-BY
Statistics 101: Point Estimators; Author: Brandon Foltz;https://www.youtube.com/watch?v=4v41z3HwLaM;License: Standard YouTube License, CC-BY
Central limit theorem; Author: 365 Data Science;https://www.youtube.com/watch?v=b5xQmk9veZ4;License: Standard YouTube License, CC-BY
Point Estimate Definition & Example; Author: Prof. Essa;https://www.youtube.com/watch?v=OTVwtvQmSn0;License: Standard Youtube License
Point Estimation; Author: Vamsidhar Ambatipudi;https://www.youtube.com/watch?v=flqhlM2bZWc;License: Standard Youtube License