
Concept explainers
Videos
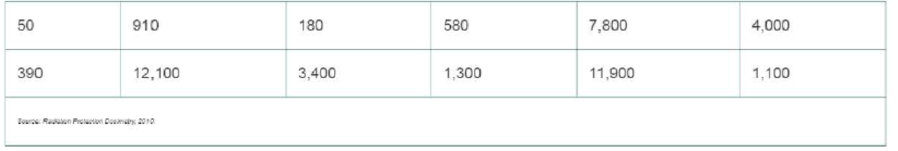
Radon exposure in Egyptian tombs. Refer to the Radiation Protection Dosimetry (December 2010) study of radon exposure in Egyptian tombs, Exercise 7.55 (p. 393). The radon levels–measured in becquerels per cubic meter (Bq/m3) –in the inner chambers of a sample of 12 tombs are reproduced in the table below. Recall that for safety purposes, the Egypt Tourism Authority (ETA) temporarily closes the tombs if the level of radon exposure in the tombs rises too high, say, 6,000 Bq/m3. Conduct a non parametric test to determine if the true median level of radon exposure in the tombs is less than 6,000 Bq/m3. Use α = .10. Should the tombs be closed?
Want to see the full answer?
Check out a sample textbook solution
Chapter 15 Solutions
MyLab Statistics for Business Stats with Pearson eText -- Standalone Access Card -- for Statistics for Business and Economics


- Listed below are amounts of strontium-90 (in millibecquerels, or mBq, per gram of calcium) in a simple random sample by baby teeth obtained from Pennsylvania residents and New York residents born after 1979. Use a 0.05 significance level and Wilcoxon rank-sum test to test the claim that the median amount of strontium-90 from Pennsylvania residents is the same as the median from New York residents. Pennsylvania 155 142 149 130 151 163 151 142 156 133 138 161 New York 133 140 142 131 134 129 128 140 140 140 137 143 1. what is the exact value of R = R 1 (Pennsylvania)? (Round off to 1 decimal place.) 2. what is the value of μ R ? (Type as a whole number.) 3. what is the value of σ R ? (Round off to 2 decimal places.) 4. what is the computed value of z ? (Round off to 2 decimal places.) 5. what is the tabular value of z ? (Round off to 2 decimal places.arrow_forwardIn a study examining overweight and obese college football players, Mathews and Wagner(2008) found that on average both offensive and defensive linemen exceeded the at-risk criterionfor body mass index (BMI). BMI is a ratio of body weight to height squared and is commonlyused to classify people as overweight or obese. Any value greater than 30 kg/m2 is considered tobe at risk. In the study, a sample of n = 17 offensive linemen averaged M = 34.4 with a standarddeviation of s = 4.0. A sample of n = 19 defensive linemen averaged M = 31.9 with s = 3.5a. Use a single-sample t test to determine whether the offensive linemen are significantly abovethe at-risk criterion for BMI. Use a one-tailed test with α = .01.b. Use a single-sample t test to determine whether the defensive linemen are significantly abovethe at-risk criterion for BMI. Use a one-tailed test with α = .01.c. Use an independent-measures t test to determine whether there is a significant differencebetween the offensive linemen…arrow_forwardThe median pH level of the rain in a certain county, was 4.90. A biologist obtains a random sample of 19 rain dates and obtains the following data. Test the hypothesis that the median pH level has decreased from 4.90 at the alpha= 0.05 level of significance.arrow_forward
- To combat antibiotic resistance, the Quality Improvement Consortium recommends a throat swab to confirm strep throat before a physician prescribes antibiotics to children under age 5. Nationally, 40 percent of children under 5 who received antibiotics did not have a throat swab. The Colorado Department of Health took a random sample of 60 children under the age of 5 who received antibiotics for throat infections and found that 18 did not have a throat swab. At α = .05, is this a statistically significant reduction over last year’s national rate of 40 percent? (a-1) Calculate the critical value. (A negative value should be indicated by a minus sign. Round your answer to 3 decimal places.) Critical value _____ (a-2) Calculate the test statistic. (A negative value should be indicated by a minus sign. Round your answer to 2 decimal places.) Test statistic _____arrow_forwardTo combat antibiotic resistance, the Quality Improvement Consortium recommends a throat swab to confirm strep throat before a physician prescribes antibiotics to children under age 5. Nationally, 40 percent of children under 5 who received antibiotics did not have a throat swab. The Colorado Department of Health took a random sample of 100 children under the age of 5 who received antibiotics for throat infections and found that 30 did not have a throat swab. At α = .05, is this a statistically significant reduction over last year’s national rate of 40 percent? (a-1) Choose the correct null and alternative hypotheses. H0: π ≥ .40 vs. H1: π < .40 H0: π ≤ .40 vs. H1: π > .40 H0: π = .40 vs. H1: π ≠ .40 (a-2) Calculate the critical value. (A negative value should be indicated by a minus sign. Round your answer to 3 decimal places.) Critical value (a-3) Calculate the test statistic. (A negative value should be indicated by a minus sign. Round your…arrow_forwardThree samples of each of three types of PVC pipe of equal wall thickness are tested to failure under three temperature conditions, yielding the results shown below. Research questions: Is mean burst strength affected by temperature and/or by pipe type? Is there a “best” brand of PVC pipe? Burst Strength of PVC Pipes (psi) Temperature PVC1 PVC2 PVC3 Hot (70º C) 247 299 239 277 287 262 283 275 279 Warm (40º C) 325 341 297 322 319 315 296 335 304 Cool (10º C) 358 375 327 366 352 334 338 359 340 Click here for the Excel Data File (a-1) Choose the correct row-effect hypotheses. a. H0: A1 ≠ A2 ≠ A3 ≠ 0 ⇐⇐ Temperature means differ H1: All the Aj are equal to zero ⇐⇐ Temperature means are the same b. H0: A1 = A2 = A3 = 0 ⇐⇐ Temperature means are the same H1: Not all the Aj are equal to zero ⇐⇐ Temperature means differ a b (a-2) Choose the correct column-effect hypotheses. a. H0: B1 ≠ B2 ≠ B3 ≠ 0 ⇐⇐…arrow_forward
- Dr. Stevenson reported the following in a journal: “F (4, 106) = 10.09, p = .04.” Should Dr. Stevenson state that there are significant differences among the variable means at a .01 alpha level?arrow_forwardA researcher reports an F-ratio with dfbetween = 2 and dfwithin = 30 for an independent-measures ANOVA. a. How many treatment conditions were compared in the experiment? b. How many subjects participated ion the experiment?arrow_forwardDr. Romanoff reported the following in a journal: “F (5, 106) = 10.09, p = .04.” Should Dr. Romanoff state that there are significant differences among the variable means at a .05 alpha level?arrow_forward
- A paper gave summary quantities for blood lead level (in micrograms per deciliter) for a sample of whites and a sample of African Americans. Data consistent with the given summary quantities is given below. Whites (W) 8.3 0.9 2.9 5.6 5.8 5.4 1.2 1.0 1.4 2.1 1.3 5.3 8.4 6.6 5.2 3.4 2.9 2.7 6.7 3.6 African Americans (AA) 4.8 1.4 0.9 10.8 2.4 0.6 5.0 5.4 6.1 2.9 5.0 2.1 7.5 3.4 13.6 1.4 3.7 3.3 14.8 3.9 (a) Calculate the values of the mean and the median for blood lead level for the sample of African Americans. mean median (b) Which of the mean or the median is larger? What characteristic of the data set explains the relative values of the mean and the median? The median is greater than the mean. This is explained by the fact that the distribution is positively skewed. The mean is greater than the median. This is explained by the fact that the distribution is positively skewed. The median is greater than the mean. This is explained by the fact that the…arrow_forwardA paper gave summary quantities for blood lead level (in micrograms per deciliter) for a sample of whites and a sample of African Americans. Data consistent with the given summary quantities is given below. Whites (W) 8.3 0.9 2.9 5.6 5.8 5.4 1.2 1.0 1.4 2.1 1.3 5.3 8.4 6.6 5.2 3.6 2.9 2.7 6.7 3.8 African Americans (AA) 4.8 1.4 0.9 10.8 2.4 0.6 5.0 5.4 6.1 2.9 5.0 2.1 7.5 3.4 13.4 1.4 3.9 3.3 14.8 4.1 (a) Calculate the values of the mean and the median for blood lead level for the sample of African Americans. meanmedian (b) Which of the mean or the median is larger? What characteristic of the data set explains the relative values of the mean and the median? The mean is greater than the median. This is explained by the fact that the distribution is positively skewed.The median is greater than the mean. This is explained by the fact that the distribution is positively skewed. The median is greater than the mean. This is explained by the fact that the…arrow_forward
 Glencoe Algebra 1, Student Edition, 9780079039897...AlgebraISBN:9780079039897Author:CarterPublisher:McGraw Hill