
EBK MODERN BUSINESS STATISTICS WITH MIC
5th Edition
ISBN: 9780100475038
Author: williams
Publisher: YUZU
expand_more
expand_more
format_list_bulleted
Concept explainers
Videos
Textbook Question
Chapter 15.2, Problem 2E
Consider the following data for a dependent variable y and two independent variables, x1 and x2.
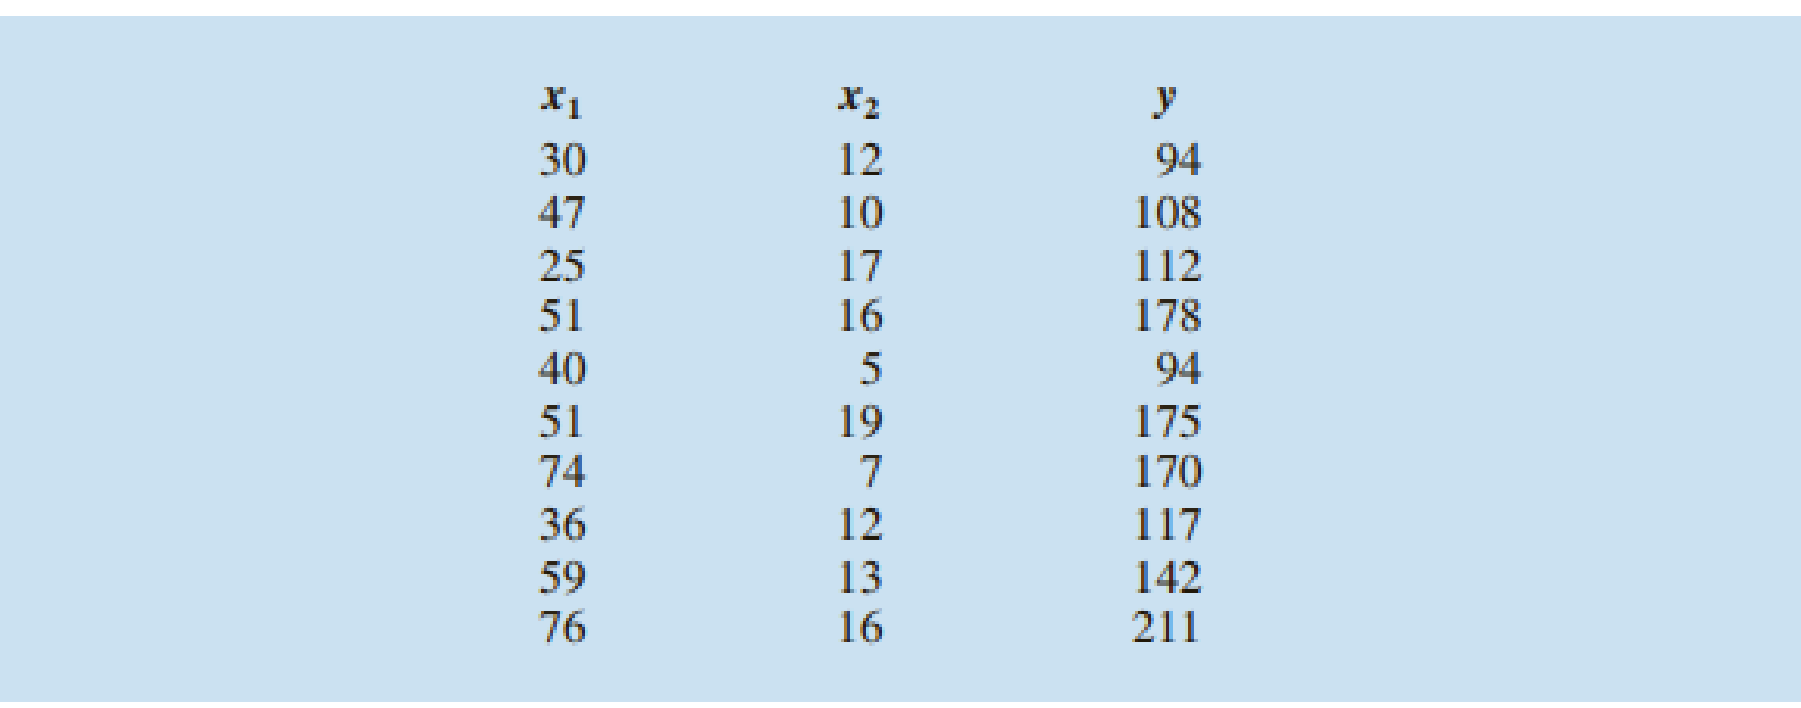
- a. Develop an estimated regression equation relating y to x1. Predict y if x1 = 45.
- b. Develop an estimated regression equation relating y to x2. Predict y if x2 = 15.
- c. Develop an estimated regression equation relating y to x1 and x2. Predict y if x1 = 45 and x2 = 15.
Expert Solution & Answer

Trending nowThis is a popular solution!

Students have asked these similar questions
Given are five observations for two variables, x and y.
xi
1
2
3
4
5
yi
4
6
6
11
13
Develop the estimated regression equation by computing the values of
b0
and
b1
using
b1 =
Σ(xi − x)(yi − y)
Σ(xi − x)2
and
b0 = y − b1x.
ŷ =
(e)
Use the estimated regression equation to predict the value of y when
x = 2.
Given are five observations for two variables, x and y.
xi
3
12
6
20
14
yi
55
45
50
15
20
#1) Develop the estimated regression equation by computing the values of b0 and b1 using
b1 =
Σ(xi − x)(yi − y)
Σ(xi − x)2
and
b0 = y − b1x.
y=
#2) Use the estimated regression equation to predict the value of y when x = 13.
Consider the following data for two variables, x and y.
x
9
32
18
15
26
y
9
19
20
15
22
Develop an estimated regression equation for the data of the form
ŷ = b0 + b1x + b2x2.
(Round b0 to two decimal places and b1 to three decimal places and b2 to four decimal places.)
ŷ =
(c)
Use the model from part (b) to predict the value of y when
x = 20.
(Round your answer to two decimal places.)
Chapter 15 Solutions
EBK MODERN BUSINESS STATISTICS WITH MIC
Ch. 15.2 - 1. The estimated regression equation for a model...Ch. 15.2 - Consider the following data for a dependent...Ch. 15.2 - Prob. 3ECh. 15.2 - 4. A shoe store developed the following estimated...Ch. 15.2 - The owner of Showtime Movie Theaters, Inc. would...Ch. 15.2 - NFL Winning Percentage. The National Football...Ch. 15.2 - Prob. 7ECh. 15.2 - Scoring Cruise Ships. The Condé Nast Traveler Gold...Ch. 15.2 - The Professional Golfers Association (PGA)...Ch. 15.2 - Baseball Pitcher Performance. Major League...
Ch. 15.3 - 11. In exercise 1, the following estimated...Ch. 15.3 - 12. In exercise 2, 10 observations were provided...Ch. 15.3 - Prob. 13ECh. 15.3 - Prob. 14ECh. 15.3 - 15. In exercise 5, the owner of Showtime Movie...Ch. 15.3 - Prob. 16ECh. 15.3 - In part (d) of exercise 9, data contained in the...Ch. 15.3 - Prob. 18ECh. 15.5 - In exercise 1, the following estimated regression...Ch. 15.5 - Prob. 20ECh. 15.5 - Prob. 21ECh. 15.5 - Prob. 22ECh. 15.5 - Testing Significance in Theater Revenue. Refer to...Ch. 15.5 - Prob. 24ECh. 15.5 - The Condé Nast Traveler Gold List provides ratings...Ch. 15.5 - Prob. 26ECh. 15.6 - Prob. 27ECh. 15.7 - 32. Consider a regression study involving a...Ch. 15.7 - Prob. 33ECh. 15.7 - 34. Management proposed the following regression...Ch. 15.7 - Repair Time. Refer to the Johnson Filtration...Ch. 15.7 - Prob. 36ECh. 15.7 - The Consumer Reports Restaurant Customer...Ch. 15.8 - Prob. 40ECh. 15.8 - Exercise 5 gave the following data on weekly gross...Ch. 15.8 - The following table reports the price, horsepower,...Ch. 15.8 - Prob. 43ECh. 15 - 49. The admissions officer for Clearwater College...Ch. 15 - The personnel director for Electronics Associates...Ch. 15 - Prob. 46SECh. 15 - Recall that in exercise 44, the admissions officer...Ch. 15 - Recall that in exercise 45 the personnel director...Ch. 15 - Prob. 49SECh. 15 - Prob. 50SECh. 15 - Fortune magazine publishes an annual list of the...Ch. 15 - The National Basketball Association (NBA) records...Ch. 15 - Consumer Research, Inc., is an independent agency...Ch. 15 - Matt Kenseth won the 2012 Daytona 500, the most...Ch. 15 - When trying to decide what car to buy, real value...
Knowledge Booster


Learn more about
Need a deep-dive on the concept behind this application? Look no further. Learn more about this topic, statistics and related others by exploring similar questions and additional content below.Similar questions
- The following fictitious table shows kryptonite price, in dollar per gram, t years after 2006. t= Years since 2006 0 1 2 3 4 5 6 7 8 9 10 K= Price 56 51 50 55 58 52 45 43 44 48 51 Make a quartic model of these data. Round the regression parameters to two decimal places.arrow_forwardOlympic Pole Vault The graph in Figure 7 indicates that in recent years the winning Olympic men’s pole vault height has fallen below the value predicted by the regression line in Example 2. This might have occurred because when the pole vault was a new event there was much room for improvement in vaulters’ performances, whereas now even the best training can produce only incremental advances. Let’s see whether concentrating on more recent results gives a better predictor of future records. (a) Use the data in Table 2 (page 176) to complete the table of winning pole vault heights shown in the margin. (Note that we are using x=0 to correspond to the year 1972, where this restricted data set begins.) (b) Find the regression line for the data in part ‚(a). (c) Plot the data and the regression line on the same axes. Does the regression line seem to provide a good model for the data? (d) What does the regression line predict as the winning pole vault height for the 2012 Olympics? Compare this predicted value to the actual 2012 winning height of 5.97 m, as described on page 177. Has this new regression line provided a better prediction than the line in Example 2?arrow_forwardGiven are five observations for two variables, x and y. xi 1 2 3 4 5 yi 4 6 5 9 14 Develop the estimated regression equation by computing the the slope and the y intercept of the estimated regression line (to 1 decimal). y^= + x Use the estimated regression equation to predict the value of y when x = 5 (to 1 decimal).y^ =arrow_forward
- Consider the following data for two variables, x and y x 9 32 18 15 26 y 9 20 22 17 23 A. Develop an estimated regression equation for the data of the form ŷ = b0 + b1x. (Round b0 to two decimal places and b1 to three decimal places.) B. Develop an estimated regression equation for the data of the form ŷ = b0 + b1x + b2x2. (Round b0 to two decimal places and b1 to three decimal places and b2 to four decimal places.) C. Use the model from part (b) to predict the value of y when x = 20. (Round your answer to two decimal places.) Please be as detailed as possible in the solution so i may follow along. Thank you for the help!arrow_forwardGiven are five observations collected in a regression study on two variables. xi 2 6 9 13 20 yi 9 18 8 25 21 (b) Develop the estimated regression equation for these data. ŷ = (c) Use the estimated regression equation to predict the value of y when x = 13.arrow_forwardGiven are five observations collected in a regression study on two variables. xi 2 6 9 13 20 yi 7 18 9 26 23 Develop the estimated regression equation for these data. ŷ = (c) Use the estimated regression equation to predict the value of y when x = 20.arrow_forward
- Consider the following data for two variables, x and y. x 22 24 26 30 35 40 y 11 21 34 36 39 36 Develop an estimated regression equation for the data of the form ŷ = b0 + b1x + b2x2. (Round b0 to one decimal place and b1 to two decimal places and b2 to four decimal places.) ŷ = (e) Use the results from part (d) to test for a significant relationship between x, x2, and y. Use ? = 0.05. Is the relationship between x, x2, and y significant? Find the value of the test statistic. (Round your answer to two decimal places.) Find the p-value. (Round your answer to three decimal places.) p-value = (f) Use the model from part (d) to predict the value of y when x = 25. (Round your answer to three decimal places.)arrow_forwardThe director of marketing at Vanguard Corporation believes that sales of the company's Bright Side laundry detergent (S) are related to Vanguard's own advertising expenditure (A), as well as the combined advertising expenditures of its three biggest rival detergent (R). The marketing director collects 36 weekly observations on S, A and R to estimate the following multiple regression equation: S = a + bA + cR .where, S, A, and R are measured in dollars per week. Vanguard's marketing director is comfortable using parameter estimates that are statistically significant at the 10% level or better.DEPENDENT VARIABLE: S R-SQUARE F-RATIO P-VALUE ON FOBSERVATIONS: 36 0.2247 4.781 0.0150VARIABLE PARAMETER STANDARD T-RATIO P-VALUE ESTIMATE ERRORINTERCEPT 175086.0 63821.0 2.74 0.0098A 0.8550 0.3250…arrow_forwardA set of X and Y scores has MX = 4, SSX = 10, MY = 5, SSY = 40, and SP = 20. Which is the regression equation for predicting Y from X?arrow_forward
- The table below shows the number of state-registered automatic weapons and the murder rate for several Northwestern states. x 11.9 8.4 6.6 3.8 2.6 2.3 2.2 0.9 y 14.2 11.1 9.6 7 6.2 6.1 5.8 5 x = thousands of automatic weaponsy = murders per 100,000 residentsThis data can be modeled by the equation y=0.85x+4.03. Use this equation to answer the following; Special Note: I suggest you verify this equation by performing linear regression on your calculator.A) How many murders per 100,000 residents can be expected in a state with 7.7 thousand automatic weapons?arrow_forwardThe admissions officer for a certain college developed the following estimated regression equation relating the final college GPA to the student's SAT mathematics score and high school GPA. ŷ = −1.39 + 0.0234x1 + 0.00482x2 where x1 = high-school grade point average x2 = SAT mathematics score y = final college grade point average. #1)A high-school average 84 corresponds to x1 = 84 and a score of 535 on the SAT mathematics test corresponds to x2 = 535. Substitute these values into the estimated regression equation to find the final college GPA, rounding the result to two decimal places. GPA = −1.39 + 0.0234x1 + 0.00482x2 = -1.39 +0.0234 (_____________) + 0.00482 (535) = __________________arrow_forward
arrow_back_ios
arrow_forward_ios
Recommended textbooks for you
 Functions and Change: A Modeling Approach to Coll...AlgebraISBN:9781337111348Author:Bruce Crauder, Benny Evans, Alan NoellPublisher:Cengage Learning
 Algebra & Trigonometry with Analytic GeometryAlgebraISBN:9781133382119Author:SwokowskiPublisher:Cengage
 College AlgebraAlgebraISBN:9781305115545Author:James Stewart, Lothar Redlin, Saleem WatsonPublisher:Cengage Learning
 Algebra and Trigonometry (MindTap Course List)AlgebraISBN:9781305071742Author:James Stewart, Lothar Redlin, Saleem WatsonPublisher:Cengage Learning
Functions and Change: A Modeling Approach to Coll...
Algebra
ISBN:9781337111348
Author:Bruce Crauder, Benny Evans, Alan Noell
Publisher:Cengage Learning
Algebra & Trigonometry with Analytic Geometry
Algebra
ISBN:9781133382119
Author:Swokowski
Publisher:Cengage
College Algebra
Algebra
ISBN:9781305115545
Author:James Stewart, Lothar Redlin, Saleem Watson
Publisher:Cengage Learning
Algebra and Trigonometry (MindTap Course List)
Algebra
ISBN:9781305071742
Author:James Stewart, Lothar Redlin, Saleem Watson
Publisher:Cengage Learning
Correlation Vs Regression: Difference Between them with definition & Comparison Chart; Author: Key Differences;https://www.youtube.com/watch?v=Ou2QGSJVd0U;License: Standard YouTube License, CC-BY
Correlation and Regression: Concepts with Illustrative examples; Author: LEARN & APPLY : Lean and Six Sigma;https://www.youtube.com/watch?v=xTpHD5WLuoA;License: Standard YouTube License, CC-BY