
Videos
Exercise 17 demonstrates that the results of the signed-rank test may be misleading when the assumption of symmetry is violated.
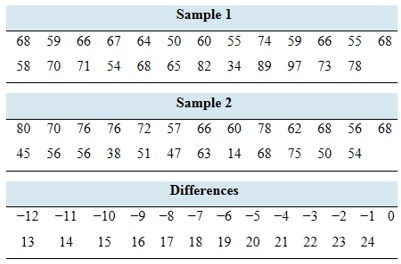
Asymmetric differences: Consider the following paired samples and their differences.
- Verify that the median of the sample differences is equal to 0.
- Compute the test statistic for the signed-rank test.
- Do you reject the null hypothesis that the median is equal to 0? Use the
a.
To verify:The median of the sample difference is
Explanation of Solution
Given information:
The level of significance is
| Sample 1 | ||||||||||
| 68 | 59 | 66 | 67 | 64 | 50 60 55 | 74 | 59 | 66 | 55 | 68 |
| 58 | 70 | 71 | 54 | 68 | 65 82 34 | 89 | 97 | 73 | 78 | |
| Sample 2 | ||||||||||
| 80 | 70 | 76 | 76 | 72 | 57 66 60 | 78 | 62 | 68 | 56 | 68 |
| 45 | 56 | 56 | 38 | 51 | 47 63 14 | 68 | 75 | 50 | 54 | |
Table-1
| Differences | ||||||||||||
| -12 | -11 | -10 | -9 | -8 | -7 | -6 | -5 | -4 | -3 | -2 | -1 | 0 |
| 13 | 14 | 15 | 16 | 17 | 18 | 19 | 20 | 21 | 22 | 23 | 24 | |
Table-2
Calculation:
From Table-2, the sample size is
The median for odd data is,
Substitute the values in above formula.
Since, the thirteenth term of table-2 is zero.
Thus, the median of difference data is
b.
To find:The test statistics.
Answer to Problem 17E
The test statistics is
Explanation of Solution
Given information:
The level of significance is
| Sample 1 | ||||||||||
| 68 | 59 | 66 | 67 | 64 | 50 60 55 | 74 | 59 | 66 | 55 | 68 |
| 58 | 70 | 71 | 54 | 68 | 65 82 34 | 89 | 97 | 73 | 78 | |
| Sample 2 | ||||||||||
| 80 | 70 | 76 | 76 | 72 | 57 66 60 | 78 | 62 | 68 | 56 | 68 |
| 45 | 56 | 56 | 38 | 51 | 47 63 14 | 68 | 75 | 50 | 54 | |
Table-1
| Differences | ||||||||||||
| -12 | -11 | -10 | -9 | -8 | -7 | -6 | -5 | -4 | -3 | -2 | -1 | 0 |
| 13 | 14 | 15 | 16 | 17 | 18 | 19 | 20 | 21 | 22 | 23 | 24 | |
Table-2
Calculation:
The MINITAB output is shown below.
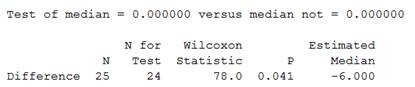
Figure-1
From Figure-1, it is clear that the test statistics is
Therefore, the test statistics is
c.
To find:Whether to reject the null hypothesis.
Answer to Problem 17E
The null hypothesis is rejected.
Explanation of Solution
Given information:
The level of significance is
| Sample 1 | ||||||||||
| 68 | 59 | 66 | 67 | 64 | 50 60 55 | 74 | 59 | 66 | 55 | 68 |
| 58 | 70 | 71 | 54 | 68 | 65 82 34 | 89 | 97 | 73 | 78 | |
| Sample 2 | ||||||||||
| 80 | 70 | 76 | 76 | 72 | 57 66 60 | 78 | 62 | 68 | 56 | 68 |
| 45 | 56 | 56 | 38 | 51 | 47 63 14 | 68 | 75 | 50 | 54 | |
Table-1
| Differences | ||||||||||||
| -12 | -11 | -10 | -9 | -8 | -7 | -6 | -5 | -4 | -3 | -2 | -1 | 0 |
| 13 | 14 | 15 | 16 | 17 | 18 | 19 | 20 | 21 | 22 | 23 | 24 | |
Table-2
Calculation:
The null hypothesis is, the median is equal to zero.
The alternative hypothesis is, the median is not equal to zero.
Since, the test statistics is
For sample size
Since, the test statistics is less than the critical value.
Thus, hypothesis
Therefore, the null hypothesis is rejected.
Want to see more full solutions like this?
Chapter 15 Solutions
ELEM. STATISTICS TEXT W/ MANUAL+CONNECT


- An article in the Journal of Quality Technology (Vol. 13, No. 2, 1981, pp. 111–114) describes an experimentthat investigates the effects of four bleaching chemicals on pulp brightness. These four chemicals wereselected at random from a large population of potential bleaching agents. The data are as follows:a. Test the significance of these chemical types with α=0.05.b. If proven significant, perform a multiple comparison method using Fisher’s LSDarrow_forwardThis chart shows the results of two random samples that measured the average number of minutes per charge for AA Lithium-ion (Li-ion) rechargeable batteries versus Nickel-Metal Hydride (NiMH) rechargeable batteries. Down below shows the hypothesis test using significance level (α) = 0.05 to determine if the true average number of minutes per charge for NiMH batteries is smaller than that for Li-ion batteries. 1. From the data given from the first graph below, what would be the correct p value? (the one tail or the two tail?) t-Test: Two-Sample Assuming Unequal Variances NiMH Li-ion Mean 89.35714 95 Variance 3.93956 59.75 Observations 14 17 Hypothesized Mean Difference 0 df 19 t Stat -2.89621 P(T<=t) one-tail 0.004628 t Critical one-tail 1.729133 P(T<=t) two-tail 0.009255 t Critical two-tail 2.093024 For the bottom graph: 1.. Find the point estimate (you can do this by subtracting Group 2…arrow_forwardIn the macro relation between GDP and FDI, Dr Mudenda obtained the following valuesfrom a Stata output: FDI coefficient of 0.45; t-statistic of 3; and covariance (GDP, FDI)value of 0.41. In literature, this relationship between GDP and FDI has generally beenestablished to be statistically significant. Answer the following questions:i) Calculate the variance of the FDI variable and explain its implicationii) Use the confidence interval approach to test whether FDI’s influence on GDP isstatically significant or not in Dr Mudenda’s study. Use 5% level which gives 1.96critical values.iii) What is the expected value of the p-values for studies that have been conductedin literature?arrow_forward
- Consider the following two independently chosen samples whose population variances are not equal to each other. Sample 1 12.1 13.4 11.7 10.7 14.0 Sample 2 10.5 9.5 8.2 7.8 11.1 a) Using a significance level of 0.025, test the null hypothesis that µ1 - µ2 ≤ 0. b) Calculate the p-value.arrow_forward. The term sample usually refers to a sample that ___ - Consists of people with chemical dependency problems - Uses the same group of individuals with a before/after measurement - Requires a dependent variable for hypothesis testing - Is randomly selected from two dependent populationsarrow_forwardThe following data were obtained from an independent-measures study comparing three treatment conditions. Calculate the sample variance for each of the three samples. Use an ANOVA with α=.05 to determine whether there are any significant differences among the three treatment means.arrow_forward
 MATLAB: An Introduction with ApplicationsStatisticsISBN:9781119256830Author:Amos GilatPublisher:John Wiley & Sons Inc
 Probability and Statistics for Engineering and th...StatisticsISBN:9781305251809Author:Jay L. DevorePublisher:Cengage Learning
 Statistics for The Behavioral Sciences (MindTap C...StatisticsISBN:9781305504912Author:Frederick J Gravetter, Larry B. WallnauPublisher:Cengage Learning
 Elementary Statistics: Picturing the World (7th E...StatisticsISBN:9780134683416Author:Ron Larson, Betsy FarberPublisher:PEARSON
 The Basic Practice of StatisticsStatisticsISBN:9781319042578Author:David S. Moore, William I. Notz, Michael A. FlignerPublisher:W. H. Freeman
 Introduction to the Practice of StatisticsStatisticsISBN:9781319013387Author:David S. Moore, George P. McCabe, Bruce A. CraigPublisher:W. H. Freeman