
Concept explainers
Videos
The following graphs appear in the paper “Which Thoughts Count? Algorithms for Evaluating Satisfaction in Relationships” (Psychological Science [2008]: 1030–1036). The vertical axis in both graphs represents mean score on a measure or relationship satisfaction.
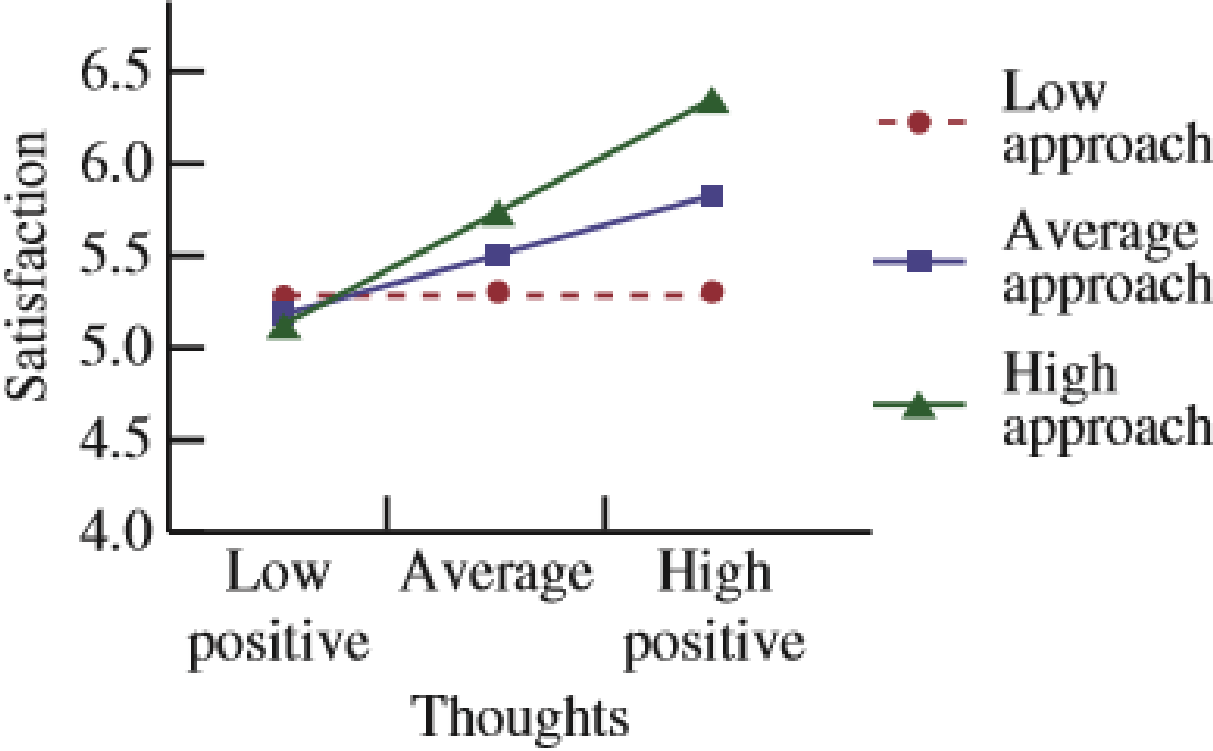
- a. In the first graph, mean relationship satisfaction is plotted for each level of a measure of thoughts of passion (on the horizontal axis with levels low positive, average, and high positive) separately for participants with low, average, and high approach goals.
Does this graph suggest an interaction between the two factors, thoughts of passion and approach goal level? What aspects of the graph support your response?
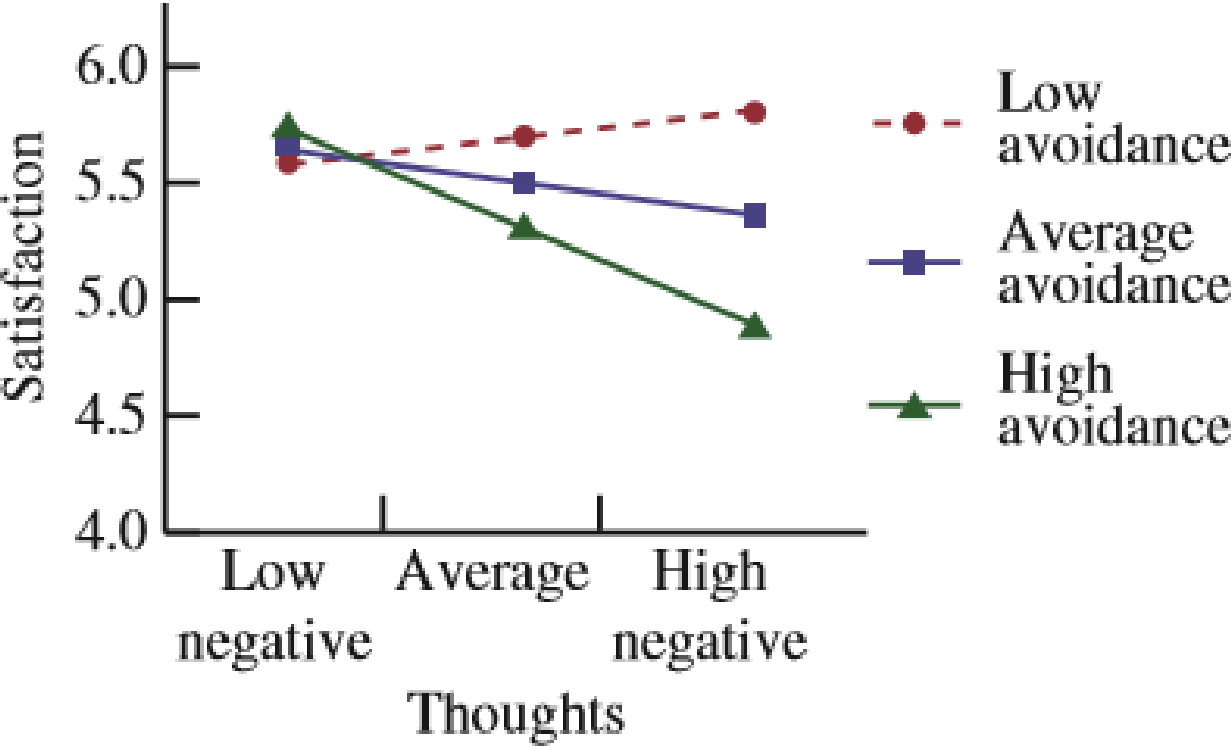
- b. In the second graph, mean relationship satisfaction is plotted for each level of a measure of thoughts of insecurity (the horizontal axis with levels low negative, average, and high negative) separately for participants with low, average, and high avoidance goals.
Does this graph suggest an interaction between the two factors, thoughts of insecurity and avoidance goal level? What aspects of the graph support your response?
- c. Consider the following quote from the paper: In short, the amount that increases in positive and negative thoughts about the relationship contributed to overall feelings of satisfaction differed in accordance with an individual’s social goals, such that positive thoughts were meaningful to participants high on approach, and negative thoughts were meaningful to those high on avoidance.
Do the given graphs support this statement? Explain.
Want to see the full answer?
Check out a sample textbook solution
Chapter 15 Solutions
Bundle: Introduction to Statistics and Data Analysis, 5th + WebAssign Printed Access Card: Peck/Olsen/Devore. 5th Edition, Single-Term


 Glencoe Algebra 1, Student Edition, 9780079039897...AlgebraISBN:9780079039897Author:CarterPublisher:McGraw Hill
 Holt Mcdougal Larson Pre-algebra: Student Edition...AlgebraISBN:9780547587776Author:HOLT MCDOUGALPublisher:HOLT MCDOUGAL
 Big Ideas Math A Bridge To Success Algebra 1: Stu...AlgebraISBN:9781680331141Author:HOUGHTON MIFFLIN HARCOURTPublisher:Houghton Mifflin Harcourt