
Concept explainers
Videos
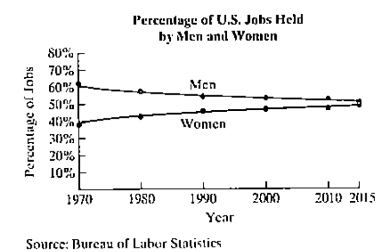
The graphs show that percentage of jobs in the U.S. labor force held by men and by women from 1970 through 2015. Exercises #x2013;110 are based on the data displayed by the graphs.
The formula
models the percentage of jobs in the U.S. labor force, p, held by women t year after 1970.
a. Use the appropriate graph at the bottom of the previous column to estimate the percentage of jobs in the U.S. labor force held by women in 2010. Give your estimate to the nearest percent.
b. Use the mathematical model to determine the percentage of jobs in the U.S. labor force held by women in 2010. Round to the nearest tenth of percent.
c. According to the formula, when will 51% of jobs in the U.S. labor force be held by women? Round to the nearest year.
Want to see the full answer?
Check out a sample textbook solution
Chapter 1 Solutions
College Algebra, Books A La Carte Edition with Integrated Review and Worksheets Plus MyLab Math with eText -- Access Card Package (7th Edition)


 Glencoe Algebra 1, Student Edition, 9780079039897...AlgebraISBN:9780079039897Author:CarterPublisher:McGraw Hill
 Algebra for College StudentsAlgebraISBN:9781285195780Author:Jerome E. Kaufmann, Karen L. SchwittersPublisher:Cengage Learning
 Algebra: Structure And Method, Book 1AlgebraISBN:9780395977224Author:Richard G. Brown, Mary P. Dolciani, Robert H. Sorgenfrey, William L. ColePublisher:McDougal Littell
 Elementary AlgebraAlgebraISBN:9780998625713Author:Lynn Marecek, MaryAnne Anthony-SmithPublisher:OpenStax - Rice University
 Algebra & Trigonometry with Analytic GeometryAlgebraISBN:9781133382119Author:SwokowskiPublisher:Cengage
 Linear Algebra: A Modern IntroductionAlgebraISBN:9781285463247Author:David PoolePublisher:Cengage Learning