
Concept explainers
Videos
Interpretation: The titration curve of a weak and a strong acid with a strong base is give. The curves are to be defined with the correct titration representation.
Concept introduction: The relative
To determine: The titration curve that corresponds to the titration of weak acid and that corresponding to the titration of strong acid.
Answer to Problem 16.1VP
Solution
The titration curve that corresponds to the titration of weak acid and that corresponding to the titration of strong acid is red and blue curve, respectively.
Explanation of Solution
Explanation
The titration graph representing the titration of a weak and a strong acid with a same strong base is given as,
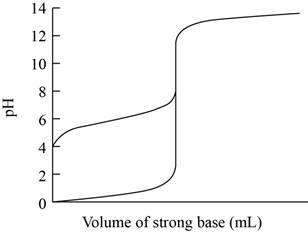
Figure 1
The initial
Stronger acid has lower initial
Therefore, blue curve represents the titration of a strong acid with a base and the red curve indicates the titration of a weak acid with a base.
Conclusion
Blue curve represents the titration of a strong acid with a base and the red curve indicates the titration of a weak acid with a base
Want to see more full solutions like this?
Chapter 16 Solutions
EBK CHEMISTRY: THE SCIENCE IN CONTEXT,


 ChemistryChemistryISBN:9781305957404Author:Steven S. Zumdahl, Susan A. Zumdahl, Donald J. DeCostePublisher:Cengage Learning
 ChemistryChemistryISBN:9781259911156Author:Raymond Chang Dr., Jason Overby ProfessorPublisher:McGraw-Hill Education
 Principles of Instrumental AnalysisChemistryISBN:9781305577213Author:Douglas A. Skoog, F. James Holler, Stanley R. CrouchPublisher:Cengage Learning
 Organic ChemistryChemistryISBN:9780078021558Author:Janice Gorzynski Smith Dr.Publisher:McGraw-Hill Education
 Chemistry: Principles and ReactionsChemistryISBN:9781305079373Author:William L. Masterton, Cecile N. HurleyPublisher:Cengage Learning
 Elementary Principles of Chemical Processes, Bind...ChemistryISBN:9781118431221Author:Richard M. Felder, Ronald W. Rousseau, Lisa G. BullardPublisher:WILEY