
Concept explainers
To fill:
The blanks in the given figure.
Introduction:
Extinction vortex is a model that helps the ecologists, biologists, and geneticists to determine the reason for the extinction of the species. This model reveals the causes that lead to the vulnerability of the small populations, as they spiral toward the extinction. This model was developed by M. E. Gilpin and M. E Soule in 1986.
Answer to Problem 1LTB
The figure below is labeled as:

Explanation of Solution
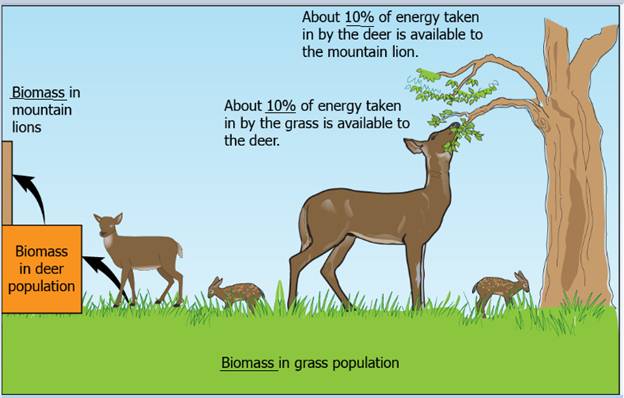
The given figures are the depiction of a graph which determines the amount of biomass of grass population transferred to mountain lions. The grass is an autotroph and makes its own food by the help of photosynthesis. When deer eat this grass, then only 10% of the energy in the grass is transferred to the deer. Further, when the lion eats the deer, then again, only 10% of the energy taken by the deer is transferred to the mountain lion.
The figure below is labeled as:
Want to see more full solutions like this?
Chapter 16 Solutions
Pearson eText Biology: Science for Life with Physiology -- Instant Access (Pearson+)


- Which of the following methods will provide information to an ecologist about both the size and density of a population? a. mark and recapture b. mark and release c. quadrat d. life tablearrow_forwardComplete the following graph by labeling each bar (a-e) with a cause of extinction, from the most influential to the least influential. а. b. C. d. е. O 20 40 60 80 100 % Species Affected by Threatarrow_forwardHumans are beginning to fragment populations more and more: which population structure is most useful in highly fragmented habitats that used to represent one large habitat? A. Source and sink modelsB. MetapopulationsC. Linear Stepping StoneD. Two dimensional stepping stone Which is typically the most appropriate population structure model when you are focusing on a remote, single island? A: Source and sink modelsB: MetapopulationsC: Linear Stepping StoneD: Two dimensional stepping stonearrow_forward
- Examine the statements below and score them as true or false. 1. According to the MacArthur-Wilson theory of island biogeography, the immigration curve starts out steep but gets progressively shallower. 2. The extinction curve also starts out steeply but quickly declines. 3. Extinction rates are lower on larger islands. 4. The numbers of species should increase with increasing distance from the mainland. (Click to select) v (Click to select) (Click to select) (Click to select) v 5. There should be considerable turnover of species on islands. (Click to select)arrow_forwardExtinction Match the following items. NOTE: If you want to change your selection, you'll need to delete the one you already chose. After you delete it, the list of choices will pop back up and you can make a different choice. Sudden, dramatic loss of biodiversity mass extinction Routine loss of biodiversity; about 1 per million species years background extinctionarrow_forwardDiscuss the types of survivorship curves, explaining the life history features found in organisms possessing different types of curves. Give at least 1 example of each.arrow_forward
- Plz asaparrow_forwardCreate four different trading cards. Include all of the provided information outlined below. For each card: One Endangered Species, One Threatened Species, One Extinct Species Species name Status Distribution Description of actions leading to decline Recovery planarrow_forwardSurvivorship curves are a never differ among close relatives within a taxonomic group. b used to depict when individuals survive well and when they do not. c the same for all populations over time. d the same for all individuals. e used to accurately determine how old individuals in a population will be at death.arrow_forward
- Provide two explanations as to why the densities of the beetles may be different in each habitat in no more than 100 words.arrow_forwardRefer to the figure to the figure below. Which letter would represent the equilibrium point for species diversity on a large island near the mainland? Immigration Extinction Near Small Large Far D вс Number of species present A. A В. В С.С D. D Е. Е Ratearrow_forwardQ2.3 1 Point Calculate the Shannon-Weiner index and Simpson's index of diversity for each island. Island A Island B Island C Save Answer *Unsaved Changesarrow_forward
 Concepts of BiologyBiologyISBN:9781938168116Author:Samantha Fowler, Rebecca Roush, James WisePublisher:OpenStax College
 Biology (MindTap Course List)BiologyISBN:9781337392938Author:Eldra Solomon, Charles Martin, Diana W. Martin, Linda R. BergPublisher:Cengage Learning
 Biology: The Dynamic Science (MindTap Course List)BiologyISBN:9781305389892Author:Peter J. Russell, Paul E. Hertz, Beverly McMillanPublisher:Cengage Learning