Concept explainers
Videos
To review:
The inferences that can be made regarding the mechanisms of silencing of each gene.
Given:
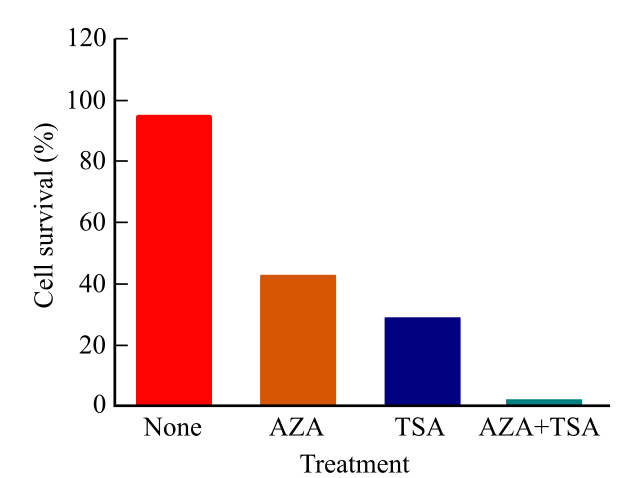
The table below represents the gene expression data after the treatment with the inhibitors of the DNA (deoxyribonucleic acid) methylation and histone deacetylation.
Introduction:
Two different compounds AZA and TSA are used to inhibit the DNA methyltransferase and histone deacetylase, respectively. The researchers studied the effects of the inhibitors both combinedly and separately.
The cells in which these genes were silenced were also tested in another experiment. These cells were incubated with the inhibitor. The genes of interest were amplified. The amplified products obtained were proportional to the original mRNA (messenger ribonucleic acid) quantities.
Want to see the full answer?
Check out a sample textbook solution
Chapter 16 Solutions
LIFE:SCIENCE OF BIOL.(LL) >CUSTOM<


- On the image, you can see the results of a DNA microarray used for cancer prognosis, where tissue samples from healthy and cancerous tissues were analyzed. cDNA from healthy cells and cancer cells were labeled with green and red fluorescence, respectively, mixed equally, and hybridized with the chip. It is known that gene A is more highly expressed in breast cancer type I, while genes B and C have lower expression in type II, which is highly aggressive. Based on the gene expression levels shown in the image, the cancer sample does not correspond to either type I or type II breast cancer, why is that?arrow_forwardWhat is the difference between an oncogene and a tumor-suppressorgene? Give two examples of each type of gene.arrow_forwardMutations in the HPRT1 gene in humans result in atleast two clinical syndromes. Consult OMIM (www.omim.org) by querying HPRT1; you will only needto look briefly at the top three hits (files #300322,300323, and 308000).a. What is the full name of the HPRT1 enzyme?b. On which chromosome is the HPRT1 gene located?c. Mutations in HPRT1 are associated with two different syndromes. What are these syndromes? Foreach, answer the following questions: (i) What arethe symptoms associated with the syndrome? (ii) Isthe mutant allele that causes the syndrome dominant, recessive, codominant, or incompletely dominant with respect to the normal allele, or do specialconditions apply? (iii) Is the syndrome associatedwith a loss-of-function or a gain-of-function disease allele? (iv) Does the syndrome display allelicheterogeneity? (v) Does the syndrome display locus heterogeneity? (Note: You do not need to understand everything in the OMIM entries to answerthese questions.)arrow_forward
- Cap, EA1, and Sap are all genes/proteins of interest in this study. For each gene, what gene product is encoded and where is the gene (the literal DNA sequence) located physically in the cell? I need help fimiding this in the artticle and answer as short as possible https://www.ncbi.nlm.nih.gov/pmc/articles/PMC106848/arrow_forwardWhat is cell differentiation? Discuss the role of myogenic bHLH proteins in the differentiation of muscle cells. Explain how they work at the molecular level. In your answer, explain how protein dimerization is key to gene regulation.arrow_forwarda) hours: 0 2 567 DMC1 SPS1 hours: 0 2 5 6 7 9 11 DIT1 SPS100 Oxygen level (% normal) b) 120 100 FIGURE 4.6. Comparison of Northern blots with DNA microarray data. a) Results from four individual Northern blots examining four different genes and measuring mRNA production over time, as indicated. b) Results from a series of microarrays for the same four genes of interest. Note the color scale on the bottom of b), where bright green indicates a 20-fold repression and bright red indicates a 20-fold induction. Black indicates no change in transcription (i.e., the merged microarray spot would have appeared yellow). 80 60 40 20 0 1 2 gene X gene Y gene Z 3 1 hour 1.0 1.0 b) 1.0 hours: 0.5 2 5 7 9 11 DMC1 SPS1 DIT1 SPS100 fold repressed >20 10x 3x3x10x >20 1:1 fold induced 4 5 6 7 8 9 10 11 Time (hours) 3 hour 2.2 4.5 1.5 5 9 hour hour 1.0 0.15 0.95 0.05 2.0 2.0 FIGURE 4.7 Transcriptional response of three genes to the gradual loss of oxygen. a) Graph of oxygen con- sumption over time by…arrow_forward
- How would you explain gene expression? How is it that a particular genotype is actually expressed as a phenotype? I am looking for details here, including an explanation of the molecular mechanisms involved.arrow_forwardHow might a point mutation in DNA affect the phenotype. How the genome is expressed in the organism? (Please explain this at the molecular level).arrow_forwardCreate a Venn diagram to compare and contrast the process of gene expression in Bacteria versus eukaryotes. Remember that “gene expression” can include any part of transcription or translation. Try to be as thorough as you can about what aspects of this process are similar between the two taxa, and what characteristics are distinct to only Bacteria or eukaryotes. Plase include a minimum of 15 items in the Venn diagram.arrow_forward
- The figure below shows differential methylation patterns for various genes in samples of 2 embryonic stem cells (ES), 5 induced pluripotent stem cells (iPSC), and 4 somatic cells. Some genes were not successfully reprogrammed. Use this figure to answer the following question. which of the following is the most accurate statement about the figure? - The genes in regions A, B, and C, all seem to be expressed in embryonic stem cells, and are silenced primarily in adult cells. - The genes in regions A, B ,and C are active in embryonic stem cells. - HDACs may be acting on genes in regions A, B , and C in the ES cells. - All of the iPSC cells are safe to use in therapy.arrow_forwardYou are studying pancreatic cancer have matched samples of tumor and healthy pancreatic tissue. You use a microarray to determine gene expression differences between these two sample. You label the healthy tissue cDNA with red fluorescnce and the tumor cDNA with green. You apply these cDNAs to your chip. Beta-actin is a housekeeping gene required for cell structure. What color would you expect the spot for this gene to be? a. Red b. Green c. Yellow d. No color e. None of the abovearrow_forwardGiven the following schematic for a gene and its associated regulatory regions, answer the following questions by placing the correct letter in the provided blanks please put in the correct letter for the questions What region would provide cell type-specific expression of genes? region What site would significantly increase gene expression rates? = region What region or regions of this gene’s coding sequence are expressed as amino acids = regionarrow_forward
 Human Anatomy & Physiology (11th Edition)BiologyISBN:9780134580999Author:Elaine N. Marieb, Katja N. HoehnPublisher:PEARSON
 Biology 2eBiologyISBN:9781947172517Author:Matthew Douglas, Jung Choi, Mary Ann ClarkPublisher:OpenStax
 Anatomy & PhysiologyBiologyISBN:9781259398629Author:McKinley, Michael P., O'loughlin, Valerie Dean, Bidle, Theresa StouterPublisher:Mcgraw Hill Education,
 Molecular Biology of the Cell (Sixth Edition)BiologyISBN:9780815344322Author:Bruce Alberts, Alexander D. Johnson, Julian Lewis, David Morgan, Martin Raff, Keith Roberts, Peter WalterPublisher:W. W. Norton & Company
 Laboratory Manual For Human Anatomy & PhysiologyBiologyISBN:9781260159363Author:Martin, Terry R., Prentice-craver, CynthiaPublisher:McGraw-Hill Publishing Co.
 Inquiry Into Life (16th Edition)BiologyISBN:9781260231700Author:Sylvia S. Mader, Michael WindelspechtPublisher:McGraw Hill Education