
Concept explainers
Videos
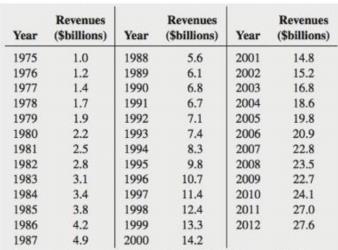
The data in the following table, stored in McDonalds, represent the gross revenues (in billions of current dollars) of McDonald's Corporation from 1975 through 2012:
a. Plot the data.
b. Compute the linear trend forecasting equation.
c. Compute the quadratic trend forecasting equation.
d. Compute the exponential mend forecasting equation.
e. Determine the best-fitting autoregressive model. using
f. Perform a residual analysis for each of the models in (h) through (e).
g. Compute the standard error of the estimate
h. On the basis of your results in (f) and (g). along with a consideration of the principle of parsimony, which model would you select for purposes of forecasting? Discuss.
i. Using the selected model in (h), forecast gross revenues for 2013.
Want to see the full answer?
Check out a sample textbook solution
Chapter 16 Solutions
Student Solutions Manual for Basic Business Statistics


- Table 6 shows the year and the number ofpeople unemployed in a particular city for several years. Determine whether the trend appears linear. If so, and assuming the trend continues, in what year will the number of unemployed reach 5 people?arrow_forwardDoes Table 1 represent a linear function? If so, finda linear equation that models the data.arrow_forwardEnter the data from Table 2 into a graphing calculator and graph the ranking scatter plot. Determine whetherthe data from the table would likely represent a function that is linear, exponential, or logarithmic.arrow_forward
- Does a linear, exponential, or logarithmic model best fit the data in Table 2? Find the model.arrow_forwardFind the equation of the regression line for the following data set. x 1 2 3 y 0 3 4arrow_forwardWhat might a scatterplot of data points look like if it were best described by a logarithmic model?arrow_forward
- Life Expectancy The following table shows the average life expectancy, in years, of a child born in the given year42 Life expectancy 2005 77.6 2007 78.1 2009 78.5 2011 78.7 2013 78.8 a. Find the equation of the regression line, and explain the meaning of its slope. b. Plot the data points and the regression line. c. Explain in practical terms the meaning of the slope of the regression line. d. Based on the trend of the regression line, what do you predict as the life expectancy of a child born in 2019? e. Based on the trend of the regression line, what do you predict as the life expectancy of a child born in 1580?2300arrow_forwardTable 6 shows the population, in thousands, of harbor seals in the Wadden Sea over the years 1997 to 2012. a. Let x represent time in years starting with x=0 for the year 1997. Let y represent the number of seals in thousands. Use logistic regression to fit a model to these data. b. Use the model to predict the seal population for the year 2020. c. To the nearest whole number, what is the limiting value of this model?arrow_forwardThe US. import of wine (in hectoliters) for several years is given in Table 5. Determine whether the trend appearslinear. Ifso, and assuming the trend continues, in what year will imports exceed 12,000 hectoliters?arrow_forward
 Functions and Change: A Modeling Approach to Coll...AlgebraISBN:9781337111348Author:Bruce Crauder, Benny Evans, Alan NoellPublisher:Cengage Learning
 Calculus For The Life SciencesCalculusISBN:9780321964038Author:GREENWELL, Raymond N., RITCHEY, Nathan P., Lial, Margaret L.Publisher:Pearson Addison Wesley,
 Algebra and Trigonometry (MindTap Course List)AlgebraISBN:9781305071742Author:James Stewart, Lothar Redlin, Saleem WatsonPublisher:Cengage Learning
 Glencoe Algebra 1, Student Edition, 9780079039897...AlgebraISBN:9780079039897Author:CarterPublisher:McGraw Hill
 Algebra & Trigonometry with Analytic GeometryAlgebraISBN:9781133382119Author:SwokowskiPublisher:Cengage