
Introduction to Statistics and Data Analysis
5th Edition
ISBN: 9781305445963
Author: PECK
Publisher: Cengage
expand_more
expand_more
format_list_bulleted
Videos
Textbook Question
Chapter 16.2, Problem 10E
In an experiment to study the way in which different anesthetics affected plasma epinephrine concentration, 10 dogs were selected and concentration was measured while they were under the influence of the anesthetics isoflurane and halothane (“Sympathoadrenal and Hemodynamic Effects of Isoflurane, Halothane, and Cyclopropane in Dogs” Anesthesiology [1974]: 465–470). The resulting data are as follows:
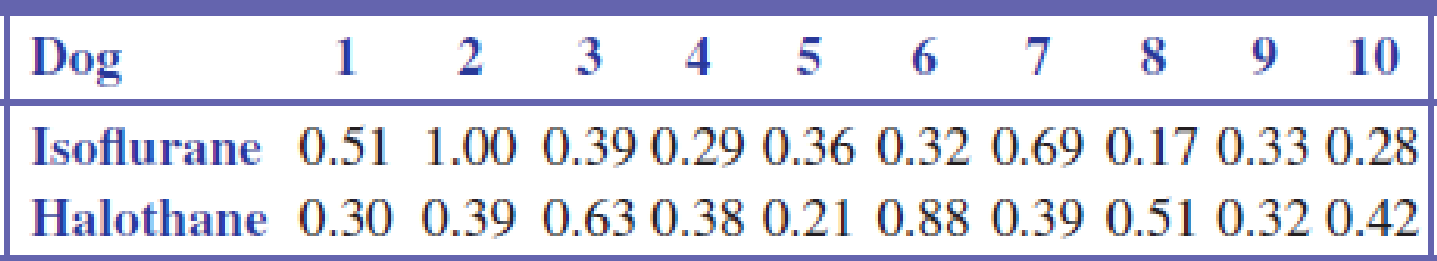
Use a level 0.05 signed-rank test to determine whether the
Expert Solution & Answer
Want to see the full answer?
Check out a sample textbook solution
Students have asked these similar questions
A paper in the Journal of Nervous and Mental Disorders reported the following data on the amount of dextroamphetamine excreted by a sample of children having organically related disorders and a sample of children with nonorganic disorders (dextroamphetamine is a drug commonly used to treat hyperkinetic children). Organic: 17.53, 20.60, 17.62, 28.93, 27.10
Nonorganic: 15.59, 14.76, 13.32, 12.45, 12.79
(Observations refer to percentage of recovery of the drug seven hours after its administration.) If we assume that the variances of the two groups of children are unequal, determine whether the true average percentages of recovery for the two conditions are equal at significance level 0.01
A study was conducted to examine the effect of diet cola consumption on calcium levels in women. A sample of 16 healthy women
aged 18 to 40 were randomly assigned to drink 24 ounces of either diet cola or water. Their urine was collected for three hours after
ingestion of the beverage and calcium excretion (in mg) was measured. The data are stored in ColaCalcium.
A study examined the impact of THC, the active ingredient in marijuana, on various physiological and psychological
variables. The study recruited a sample of 18 young adults who were habitual marijuana smokers. Participants came to the
lab 3 times, each time completing the entire series of tests and questionnaire, but each time smoking a different marijuana
cigarette: one with 3.9% THC, one with 1.8% THC, and one with no THC, a placebo. The order of the conditions was
randomized and participants were not told how much THC was in the cigarette they smoked until after all the data were
collected. This is an example of
a completely randomized experiment.
O a case-control observational study.
an anecdotal evidence.
O a matched pairs or repeated measures experiment.
Incorrect
Chapter 16 Solutions
Introduction to Statistics and Data Analysis
Ch. 16.1 - Urinary fluoride concentration (in parts per...Ch. 16.1 - Prob. 2ECh. 16.1 - Prob. 3ECh. 16.1 - A blood lead level of 70 mg/ml has been commonly...Ch. 16.1 - The effectiveness of antidepressants in treating...Ch. 16.1 - Prob. 6ECh. 16.1 - Prob. 7ECh. 16.2 - The effect of a restricted diet in the treatment...Ch. 16.2 - Peak force (N) on the hand was measured just prior...Ch. 16.2 - In an experiment to study the way in which...
Ch. 16.2 - Prob. 11ECh. 16.2 - Prob. 12ECh. 16.2 - Prob. 13ECh. 16.2 - Prob. 14ECh. 16.2 - Prob. 15ECh. 16.2 - Prob. 16ECh. 16.2 - Prob. 17ECh. 16.2 - The signed-rank test can be adapted for use in...Ch. 16.3 - Prob. 19ECh. 16.3 - Prob. 20ECh. 16.3 - The given data on phosphorus concentration in...Ch. 16.3 - Prob. 22ECh. 16.3 - Prob. 23ECh. 16.3 - The following data on amount of food consumed (g)...Ch. 16.3 - The article Effect of Storage Temperature on the...
Knowledge Booster


Learn more about
Need a deep-dive on the concept behind this application? Look no further. Learn more about this topic, statistics and related others by exploring similar questions and additional content below.Similar questions
- & The accompanying table gives plasma epinephrine concentration for ten experimental subjects during (1) isoflurane, (2) halothane, and (3) cyclopropane anesthesia ("Sympathoadrenal and Hemodynamic Effects of Isoflurane, Halothane, and Cyclopropane in Dogs." Anesthesiology, 1974: 465-470). a. Does the choice of anesthetic affect true average concentration? Test H: a, = a, = a, = 0 at level .05 after constructing the ANOVA table. %3D Subject (B) 2 3 4 5 .51 1.00 .39 28 .39 29 Anesthetic 38 .21 2 .30 3 1.07 1.35 .63 (A) .69 .28 1.24 6. 7 8 10 33 17 .32 .56 1.02 .69 .32 .39 1 .36 Anesthetic 2 .88 51 .42 (A) 3 1.53 49 .30 ΣΣή-13.7980arrow_forwardIn an experiment on immunization of cattle from tuberculosis, the following results were obtained: Affected Unaffected Inoculated 12. 28Not Inoculated 13 7Examine the effect of vaccine in controlling the incidence of the disease.arrow_forwardIn a study conducted in the Science Department of Faculty of Science, Technology and Human Development in a University; the researcher examined the influence of the drug succinylcholine on the circulation levels of androgens in the blood. Blood samples from wild, free-ranging deer were obtained via the jugular vein immediately after an intramuscular injection of succinylcholine using darts and a capture gun. Deer were bled again approximately 30 minutes after the injection and then released. The level of androgens at time of capture and 30 minutes later, measured in nanograms per milliliter (ng/ml), for 15 deers as in Table Q1. Assuming that the populations of androgen at time of injection and 30 minutes later are normally distributed:i) Find the average and standard deviation of this studyii)Determine the critical region of this problem.iii) Test at the 0.05 level of significance whether the androgen concentrations are altered after 30 minutes of restraint.arrow_forward
- A study of estrogen levels in two different groups of women finds the following results (in pg/mL): Group A: 18.7 20.6 20.7 19.7 19.9 19.4 20.2 21.6 18.8 14.1 21.6 16.2 21.7 20.8 19.3 21.3 19.9 20.8 23.2Group B: 15.2 36.2 27.5 4.7 24.5 29.4 25.9 62.8 Some summary statistics to help you: ¯y s n Group A: 19.921=(y) 2.0457=(s) 19=(n)Group B: 28.275=(y) 16.9169=(s) 8=(n) a. Is there a difference in estrogen levels? (Note: d.f. = 7.0864 for Welch's t-test). Use α = 0.05. b. Repeat, but this time assume equal variances. Use the same level of α you used before.arrow_forwardI am trying to find the breakdown of the alpha, sensitivity, and specificity .. I hope this makes sense.arrow_forwardA deficiency of the trace element selenium in the diet can negatively impact growth, immunity, muscle and neuromuscular function, and fertility. The introduction of selenium supplements to dairy cows is justified when pastures have low selenium levels. Authors of a research paper supplied the following data on milk selenium concentration (mg/L) for a sample of cows given a selenium supplement (the treatment group) and a control sample given no supplement, both initially and after a 9-day period. Initial Measurement Treatment Control 11.4 9.1 9.6 8.7 10.1 9.7 8.5 10.8 10.2 10.9 10.6 10.6 11.9 10.1 9.9 12.3 10.7 8.8 10.2 10.4 10.3 10.9 11.4 10.4 9.3 11.6 10.6 10.9 10.9 8.3 After 9 Days Treatment Control 138.3 9.2 104 8.9 96.4 8.9 89 10.1 88 9.6 103.8 8.6 147.3 10.4 97.1 12.4 172.6 9.2 146.3 9.5 99 8.4 122.3 8.8 103 12.5 117.8 9.1 121.5 93 (a) Use the given data for the treatment group to determine if…arrow_forward
- To increase the adhesiveness of a certain rubber product, an experiment was conducted. Sixteen products were made with the new additive and another 16 without the new additive with the following data recorded. Perform an ANOVA test to determine for significant main and interaction effects at the 0.05 level. Temperature (°C) 50 55 60 80 Without Additives 2.2 2.8 3.0 3.1 3.2 3.7 3.6 3.1 3.9 3.9 4.0 3.9 3.9 3.1 3.0 2.6 With Additives 4.4 3.9 3.9 4.3 3.8 3.8 4.0 3.6 4.0 4.1 3.7 3.6 3.5 3.6 3.8 4.0 Sources of Variation Sum of Squares df Mean Square fc Total:arrow_forwardTo increase the adhesiveness of a certain rubber product, an experiment was conducted. Sixteen products were made with the new additive and another 16 without the new additive with the following data recorded. Perform an ANOVA test to determine for significant main and interaction effects at the 0.05 level. Temperature(°C) 50 55 60 80 Without Additives 2.2 3.2 3.9 3.9 2.8 3.7 3.9 3.1 3.0 3.6 4.0 3.0 3.1 3.1 3.9 2.6 With Additives 4.4 3.8 4.0 3.5 3.9 3.8 4.1 3.6 3.9 4.0 3.7 3.8 4.3 3.6 3.6 4.0 Sources of Sum of Squares df Mean Square Fc Variation Total:arrow_forwardA deficiency of the trace element selenium in the diet can negatively impact growth, immunity, muscle and neuromuscular function, and fertility. The introduction of selenium supplements to dairy cows is justified when pastures have low selenium levels. Authors of a research paper supplied the following data on milk selenium concentration (mg/L) for a sample of cows given a selenium supplement (the treatment group) and a control sample given no supplement, both initially and after a 9-day period. Initial Measurement Treatment Control 11.2 9.1 9.6 8.7 10.1 9.7 8.5 10.8 10.3 10.9 10.6 10.6 11.7 10.1 9.7 12.3 10.8 8.8 10.3 10.4 10.4 10.9 11.2 10.4 9.4 11.6 10.6 10.9 10.7 8.4 After 9 Days Treatment Control 138.3 9.3 104 8.7 96.4 8.7 89 10.1 88 9.6 103.8 8.6 147.3 10.2 97.1 12.2 172.6 9.3 146.3 9.5 99 8.2 122.3 8.9 103 12.5 117.8 9.1 121.5 93 (a) Use the given data for the treatment group to determine if there…arrow_forward
- The Lion’sMane. In a study by P. M.West titled “The Lion’s Mane” (American Scientist, Vol. 93, No. 3, pp. 226–236), the effects of the mane of a male lion as a signal of quality to mates and rivals was explored. Four life-sized dummies of male lions provided a tool for testing female response to the unfamiliar lions whose manes varied by length (long or short) and color (blonde or dark). The female lions were observed to see whether they approached each of the four life-sized dummies. a. experimental units. b. response variable. c. factor(s). d. levels of each factor. e. treatments.arrow_forwardEmpty Stomachs. In the publication “How Often Do Fishes ‘Run on Empty’?” (Ecology, Vol. 83, No 8, pp. 2145–2151), D. Arrington et al. examined almost 37,000 fish of 254 species from the waters of Africa, South and Central America, and North America to determine the percentage of fish with empty stomachs. The fish were classified as piscivores (fish-eating), invertivores (invertibrateeating), omnivores (anything-eating) and algivores/detritivores (eating algae and other organic matter). For those fish in African waters, the data on theWeissStats site give the proportions of each species of fish with empty stomachs. At the 1% significance level, do the data provide sufficient evidence to conclude that a difference exists in the mean percentages of fish with empty stomachs among the four different types of feeders? a. conduct a one-way ANOVA test on the data. b. interpret your results from part (a). c. decide whether presuming that the assumptions of normal populations and equal…arrow_forwardA deficiency of the trace element selenium in the diet can negatively impact growth, immunity, muscle and neuromuscular function, and fertility. The introduction of selenium supplements to dairy cows is justified when pastures have low selenium levels. Authors of a research paper supplied the following data on milk selenium concentration (mg/L) for a sample of cows given a selenium supplement (the treatment group) and a control sample given no supplement, both initially and after a 9-day period. Initial Measurement Treatment Control 11.3 9.1 9.7 8.7 10.1 9.7 8.5 10.8 10.4 10.9 10.7 10.6 11.8 10.1 9.8 12.3 10.6 8.8 10.4 10.4 10.2 10.9 11.3 10.4 9.2 11.6 10.7 10.9 10.8 8.2 After 9 Days Treatment Control 138.3 9.4 104 8.8 96.4 8.8 89 10.1 88 9.7 103.8 8.7 147.3 10.3 97.1 12.3 172.6 9.4 146.3 9.5 99 8.3 122.3 8.9 103 12.5 117.8 9.1 121.5 93 (a) Use the given data for the treatment group to determine if…arrow_forward
arrow_back_ios
SEE MORE QUESTIONS
arrow_forward_ios
Recommended textbooks for you
 Glencoe Algebra 1, Student Edition, 9780079039897...AlgebraISBN:9780079039897Author:CarterPublisher:McGraw Hill
Glencoe Algebra 1, Student Edition, 9780079039897...
Algebra
ISBN:9780079039897
Author:Carter
Publisher:McGraw Hill
Hypothesis Testing using Confidence Interval Approach; Author: BUM2413 Applied Statistics UMP;https://www.youtube.com/watch?v=Hq1l3e9pLyY;License: Standard YouTube License, CC-BY
Hypothesis Testing - Difference of Two Means - Student's -Distribution & Normal Distribution; Author: The Organic Chemistry Tutor;https://www.youtube.com/watch?v=UcZwyzwWU7o;License: Standard Youtube License