
Concept explainers
Videos
When installing a bath faucet, it is important to properly fasten the threaded end of the faucet stem to the water-supply line. The threaded stem dimensions must meet product specifications, otherwise malfunction and leakage may occur. Authors of “Improving the Process Capability of a Boring Operation by the Application of Statistical Techniques” (Intl. J. Sci. Engr. Research, Vol. 3, Issue 5, May 2012) investigated the production process of a particular bath faucet manufactured in India. The article reported the threaded stem diameter (target value being 13 mm) of each faucet in 25 samples of size 4 as shown here: Calculate control limits based on using the sample
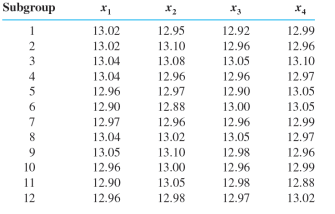
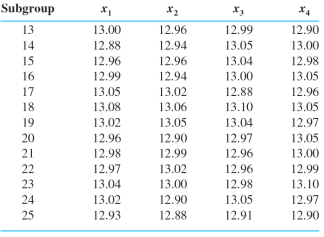
Calculate control limits based on using the sample ranges to estimate σ. Does the process appear to be in control?
Want to see the full answer?
Check out a sample textbook solution
Chapter 16 Solutions
Probability and Statistics for Engineering and the Sciences


- Determine the kurtosis if the data given is a sample.arrow_forwardThe new version of the Standard requires the measurement uncertainty (MU) contributions of sampling to be considered Comment on whether this is still applicable if the facility is not accredited for sampling or is not responsible for sampling.arrow_forwardLactation promotes a temporary loss of bone mass to provide adequate amounts of calcium for milk production. The paper “Bone Mass Is Recovered from Lactation to Postweaning in Adolescent Mothers with Low Calcium Intakes” (Amer. J. of Clinical Nutr., 2004: 1322–1326) gave the following data on total body bone mineral content (TBBMC) (g) for a sample both during lactation (L) and in the postweaning period (P). SubjectL 1928 2549 2825 1924 1628 2175 2114 2621 1843 2541P 2126 2885 2895 1942 1750 2184 2164 2626 2006 2627 Does the data suggest that true average total body bone mineral content during postweaning exceeds that during lactation by more than 25 g? State and test the appropriate hypotheses using a significance level of .05.arrow_forward
- Based of the results of ANOVA shown, test whether the mean Grain Yield is equal across all levels of the Planting Density. Present all components of the testing procedure (a=0.05) Ho:? Ha:? F and PValue:? Reject Ho if:? Conclusion:?arrow_forwardIf the alpha level changed from a=0.05 to a=0.01, what happens to the critical region and ehat happens to the probability of type 1 errorarrow_forwardFind the t-value that form the boundaries of the critical region for a two-tailed test with a= 0.01 and a sample size of 25.arrow_forward
- The article “Structural Performance of Rounded Dovetail Connections Under Different Loading Conditions” (T. Tannert, H. Prion, and F. Lam, Can J Civ Eng, 2007:1600–1605) describes a study of the deformation properties of dovetail joints. In one experiment, 10 rounded dovetail connections and 10 double rounded dovetail connections were loaded until failure. The rounded connections had an average load at failure of 8.27 kN with a standard deviation of 0.62 kN. The double-rounded connections had an average load at failure of 6.11 kN with a standard deviation of 1.31 kN. Can you conclude that the mean load at failure is greater for rounded connections than for double-rounded connections?arrow_forwardA mixture of pulverized fuel ash and Portland ce-ment to be used for grouting should have a true aver-age compressive strength of more than 1300 KN/m2. The mixture will not be used unless experimental evidence indicates conclusively that the strength specification has been met. State the relevant hy-potheses, and describe the type I and type II errors in the context of this problem.arrow_forwardTwo types of valves are being tested to determine if there is a difference in pressure tolerances. Fifteen out of a random sample of 100 of Valve A cracked under 4,500 psi. Six out of a random sample of 100 of Valve B cracked under 4,500 psi. Test at a 5% level of significancearrow_forward
- Chen et al. (2000) examined the foraging behaviour of northern elephant seals (Mirounga angustirostris) that breed along the west coast of Mexico and the USA. They attached platform satellite transmitter terminals (PTTs) to 22 male seals and recorded, for each seal, the distance (km) to its main feeding area offshore and the amount of time (days) it spent at the feeding area. The results are presented below What two null hypotheses are being tested with the output shown above? What statistical conclusions would you draw about these hypotheses? Complete the regression equation by filling in the blanks (to the nearest 3 decimal places). duration = + * distance What is one biological interpretation of this relationship between duration and distance ? What % of the variation in duration at main feeding area was explained by distance to feeding area?arrow_forwardThe article “Dynamics of Insulin Action in Hypertension: Assessment from Minimal ModelInterpretation of Intravenous Glucose Tolerance Test Data” (R. Burattini, M. Morettini, etal., Med Biol Eng Comput, 2011:831–841) compared levels of an insulin sensitivity index SIin patients with high blood pressure and patients with normal blood pressure. Ten patientswith high blood pressure had a mean value of 3.4 with a standard deviation of 0.6, and eightpatients with normal blood pressure had a mean value of 7.9 with a standard deviation of0.6. Units are 10−5 · min−1 · pmol−1. Find a 98% confidence interval for the difference inmean levels between those with high blood pressure and those with normal blood pressure.arrow_forwardThe following table represents collected data from literature regarding the inelastic axial capacity (Pn) of Aluminum symmetric profiles as a function of the Area of the section and the Slenderness Ratio (SR) of the bar. Produce a linear model for the capacity in the form Pn= C1 X Area + C2 X SR, show the statistics of the linear model on this paper. Use your linear model to predict Pn for the case of Area= 200 and SR = 35. Produce a 95% confidence interval for your expected value of Pn at Area=200mm2 and SR=35. Find the maximum possible Pn and the minimum possible Pn based on 95% confidence limits of the parameters. Suggest how to improve your model by saying which one of the two factors must be treated nonlinearly and show why you think so! (give at least one direct reason) Area (mm2) SR (-) Pn (kN) 198.3 16 1273 216.3 89 136.5 228 94 129 184.3 83 133.8 220.1 99 112.3 166.7 33 765.4 201.5 70 205.6 219.8 53…arrow_forward
 MATLAB: An Introduction with ApplicationsStatisticsISBN:9781119256830Author:Amos GilatPublisher:John Wiley & Sons Inc
 Probability and Statistics for Engineering and th...StatisticsISBN:9781305251809Author:Jay L. DevorePublisher:Cengage Learning
 Statistics for The Behavioral Sciences (MindTap C...StatisticsISBN:9781305504912Author:Frederick J Gravetter, Larry B. WallnauPublisher:Cengage Learning
 Elementary Statistics: Picturing the World (7th E...StatisticsISBN:9780134683416Author:Ron Larson, Betsy FarberPublisher:PEARSON
 The Basic Practice of StatisticsStatisticsISBN:9781319042578Author:David S. Moore, William I. Notz, Michael A. FlignerPublisher:W. H. Freeman
 Introduction to the Practice of StatisticsStatisticsISBN:9781319013387Author:David S. Moore, George P. McCabe, Bruce A. CraigPublisher:W. H. Freeman