
Applied Statistics in Business and Economics
5th Edition
ISBN: 9780077837303
Author: David Doane, Lori Seward Senior Instructor of Operations Management
Publisher: McGraw-Hill Education
expand_more
expand_more
format_list_bulleted
Concept explainers
Videos
Textbook Question
Chapter 16.3, Problem 5SE
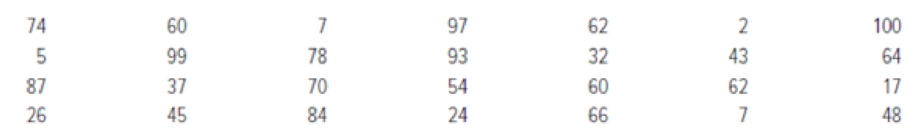
A sample of 28 student scores on the chemistry midterm exam is shown. (a) At α = .10, does the population median differ from 50? Make a worksheet in Excel for your calculations. (b) Make a histogram of the data. Would you be justified in using a parametric t test that assumes normality? Explain.
Expert Solution & Answer
Want to see the full answer?
Check out a sample textbook solution
Students have asked these similar questions
In a sample of 300 steel rods, the correlation coefficient between diameter and length was r = 0.15. Find the P-value for testing H0: ρ ≤ 0 vs. H1: ρ > 0. Can you conclude that ρ > 0? Does the result in part (a) allow you to conclude that there is a strong correlation between eccentricity and smoothness? Explain.
What statistical test would be most appropriate if you were interested in seeing how religiosity changes in early adulthood? Religiosity was measured using an interval scale, and the same participants provided data at two time points – at age 15 and 25. Assume the data meets all assumptions for a parametric test
Which non-parametric test for ordinal data is the best to use in the given scenario?
In a study by Zuckerman and Heneghan, hemodynamic stresses were measured on subjects undergoing laparoscopic cholecystectomy. An outcome variable of interest was the ventricular end-diastolic volume (LVEDV) measured in mm. A portion of the data appears in the following table. Baseline refers to a measurement taken 5 minutes after induction of anesthesia, and the term '5 minutes' refers to a measurement taken 5 minutes after baseline. Can we conclude that, on the basis of these data, among subjects undergoing laparoscopic cholecystectomy, the average LVEDV levels change? Let a =.01.
LVEDV (ml)
Subject
Baseline
5 minutes
1
51.7
49.3
2
79.0
72.0
3
78.7
67.0
4
80.3
70.4
5
72.0
65.9
6
85.0
84.8
7
79.0
77.7
8
71.3
74.0
9
54.3
58.0
10
58.8
65.0
a. Mood Median Test
b. Sign Test
c. Wilcoxon Rank Sum Test
d. Wilcoxon Matched-Pair Signed-Ranks Test
e. Spearman and Kendall Correlation…
Chapter 16 Solutions
Applied Statistics in Business and Economics
Ch. 16.2 - Prob. 1SECh. 16.2 - Prob. 2SECh. 16.2 - Prob. 3SECh. 16.2 - Prob. 4SECh. 16.3 - A sample of 28 student scores on the chemistry...Ch. 16.3 - Prob. 6SECh. 16.4 - Prob. 7SECh. 16.4 - Prob. 8SECh. 16.5 - Prob. 9SECh. 16.5 - The results shown below are mean productivity...
Ch. 16.6 - Consumers are asked to rate the attractiveness of...Ch. 16.6 - Prob. 12SECh. 16.7 - Prob. 13SECh. 16.7 - Prob. 14SECh. 16 - Prob. 1CRCh. 16 - Prob. 2CRCh. 16 - Prob. 3CRCh. 16 - Prob. 4CRCh. 16 - Prob. 5CRCh. 16 - Prob. 6CRCh. 16 - Prob. 7CRCh. 16 - Prob. 8CRCh. 16 - Prob. 9CRCh. 16 - Prob. 10CRCh. 16 - (a) Why is a significant correlation not proof of...Ch. 16 - Prob. 15CECh. 16 - Prob. 16CECh. 16 - Prob. 17CECh. 16 - Prob. 18CECh. 16 - Prob. 19CECh. 16 - Instructions: In all exercises, you may use a...Ch. 16 - Prob. 21CECh. 16 - Prob. 22CECh. 16 - Prob. 23CECh. 16 - Prob. 24CECh. 16 - Prob. 25CECh. 16 - Instructions: In all exercises, you may use a...Ch. 16 - Prob. 27CECh. 16 - Instructions: In all exercises, you may use a...Ch. 16 - Prob. 29CECh. 16 - Prob. 30CECh. 16 - Prob. 31CECh. 16 - Prob. 32CECh. 16 - Prob. 33CECh. 16 - Prob. 34CECh. 16 - Instructions: In all exercises, you may use a...Ch. 16 - Prob. 36CECh. 16 - Prob. 37CE
Knowledge Booster


Learn more about
Need a deep-dive on the concept behind this application? Look no further. Learn more about this topic, statistics and related others by exploring similar questions and additional content below.Similar questions
- Solve the problem with the appropriate type of non-parametric test. Listed below are amounts of strontium-90 (in millibecquerels, or mBq, per gram of calcium) in a simple random sample of baby teeth obtained. Use a 0.05 significance level to test the claim that the median from Manila residents is the same as the median from Cebu residents. Manila 155 142 149 130 151 163 151 142 Cebu 133 140 142 131 134 129 128 140arrow_forwardFind the equation of the normal curve y=2x+(6/x) at x=8.arrow_forwardWhat parametric test is used when you want to compare more than two independent samples? a. Chi-square b. Independent t-test c. z-test d. one-way ANOVAarrow_forward
- Which of the non-parametric test for ordinal data is the best to use in the given scenario? An experiment was conducted to compare the strengths of two types of elastic bandages: one a standard bandage of a specified weight and the other the same standard but treated with a chemical substance. Ten pieces of each were randomly selected from production. Does the treated bandage tend to be stronger than the standard? Table 1. Strength measurements (and their ranks) for 2 types of bandages. STANDARD TREATED 1.21(2) 1.49(15) 1.43(12) 1.37(7.5) 1.35(6) 1.67(20) 1.51(17) 1.50(16) 1.39(9) 1.31(5) 1.17(1) 1.29(3.5) 1.48(14) 1.52(18) 1.42(11) 1.37(7.5) 1.29(3.5) 1.44(13) 1.4(10) 1.53(19) a. Mood median test b. sign test c. Wilcoxon rank-sum test d. Wilcoxon matched-pairs signed-ranks test e. Spearman and Kendall correlation coefficients f. Kruskal-Wallis testarrow_forwardUsing the regression line attached. Based on only the above plot, one can conclude: a) height causes an increase in weight b) weight causes an increase in height c) taller people are more likely to weigh more than shorter people, at least in the sample on which this data is based d) a statistically significant predictive relationship between height and weight e) c and darrow_forwardConsider two χ2-curves with degrees of freedom 12 and 20, respectively. Which one more closely resembles a normal curve? Explain your answer.arrow_forward
- a. Interpret the effect of a three (3) unit increase in Length on the response of Weight. b. The p-value to test the null hypothesis that the slope on Length is 0 (H0 : β1 = 0), isapproximately 0. What can you say about Length being a significant explanatory variable orcovariate when explaining Weight?arrow_forwardOn the first class exam, the coefficient of determination between the hours studied and the grade earned was 66%. The standard error of the estimate was 5. There were 15 students in the class. Develop an ANOVA table for the regression analysis of hours studied as a predictor of the grade earned on the first exam. (round answers to 2 decimal places) Source DF SS MS Regression Error Totalarrow_forwardA researcher was interested in whether head worn displays were better than tablet displays for assisting rst responders with their tasks. He had 17 paramedics use either a head worn display (n = 9) or a tablet display (n = 8) during a simulated medical emergency. Each paramedic’s subjective workload score was measured out of 20 (where 20 indicated the highest workload). The data did not conform to the assumptions of a parametric test. a. What is the rank sum for the Head worn display group? a. 80 b. 73 c. 71 d. 82 b. What is the WS? a. 71 b. 80 c. 73 d. 82 c. What critical value of WS do you compare your obtained value to? a. 53 b. 54 c. 49 d. 51arrow_forward
- What is the average value of y for the part of the curve y=3x - x'2, which is the first quadrant?arrow_forwardWhich of the following is NOT a plot of residuals typically used in multiple regression analysis with two independent variables (X1 and X2)? Select one: a. Residuals versus X2. b. Residuals versus correlation coefficients. c. Residuals versus time. d. Residuals versus X1.arrow_forwardConsider a linear regression model for the decrease in blood pressure (mmHg) over a four-week period with muy=2.8+0.8x and standard deviation chi=3.2. The explanatory variable x is the number of servings fruits and vegetables in a calorie-controlled diet. The decrease in blood pressure y will vary about this subpopulation mean. What is the distribution of y for this subpopulation?arrow_forward
arrow_back_ios
SEE MORE QUESTIONS
arrow_forward_ios
Recommended textbooks for you
 MATLAB: An Introduction with ApplicationsStatisticsISBN:9781119256830Author:Amos GilatPublisher:John Wiley & Sons Inc
 Probability and Statistics for Engineering and th...StatisticsISBN:9781305251809Author:Jay L. DevorePublisher:Cengage Learning
 Statistics for The Behavioral Sciences (MindTap C...StatisticsISBN:9781305504912Author:Frederick J Gravetter, Larry B. WallnauPublisher:Cengage Learning
 Elementary Statistics: Picturing the World (7th E...StatisticsISBN:9780134683416Author:Ron Larson, Betsy FarberPublisher:PEARSON
 The Basic Practice of StatisticsStatisticsISBN:9781319042578Author:David S. Moore, William I. Notz, Michael A. FlignerPublisher:W. H. Freeman
 Introduction to the Practice of StatisticsStatisticsISBN:9781319013387Author:David S. Moore, George P. McCabe, Bruce A. CraigPublisher:W. H. Freeman
MATLAB: An Introduction with Applications
Statistics
ISBN:9781119256830
Author:Amos Gilat
Publisher:John Wiley & Sons Inc
Probability and Statistics for Engineering and th...
Statistics
ISBN:9781305251809
Author:Jay L. Devore
Publisher:Cengage Learning
Statistics for The Behavioral Sciences (MindTap C...
Statistics
ISBN:9781305504912
Author:Frederick J Gravetter, Larry B. Wallnau
Publisher:Cengage Learning
Elementary Statistics: Picturing the World (7th E...
Statistics
ISBN:9780134683416
Author:Ron Larson, Betsy Farber
Publisher:PEARSON
The Basic Practice of Statistics
Statistics
ISBN:9781319042578
Author:David S. Moore, William I. Notz, Michael A. Fligner
Publisher:W. H. Freeman
Introduction to the Practice of Statistics
Statistics
ISBN:9781319013387
Author:David S. Moore, George P. McCabe, Bruce A. Craig
Publisher:W. H. Freeman
Correlation Vs Regression: Difference Between them with definition & Comparison Chart; Author: Key Differences;https://www.youtube.com/watch?v=Ou2QGSJVd0U;License: Standard YouTube License, CC-BY
Correlation and Regression: Concepts with Illustrative examples; Author: LEARN & APPLY : Lean and Six Sigma;https://www.youtube.com/watch?v=xTpHD5WLuoA;License: Standard YouTube License, CC-BY