
Concept explainers
Videos
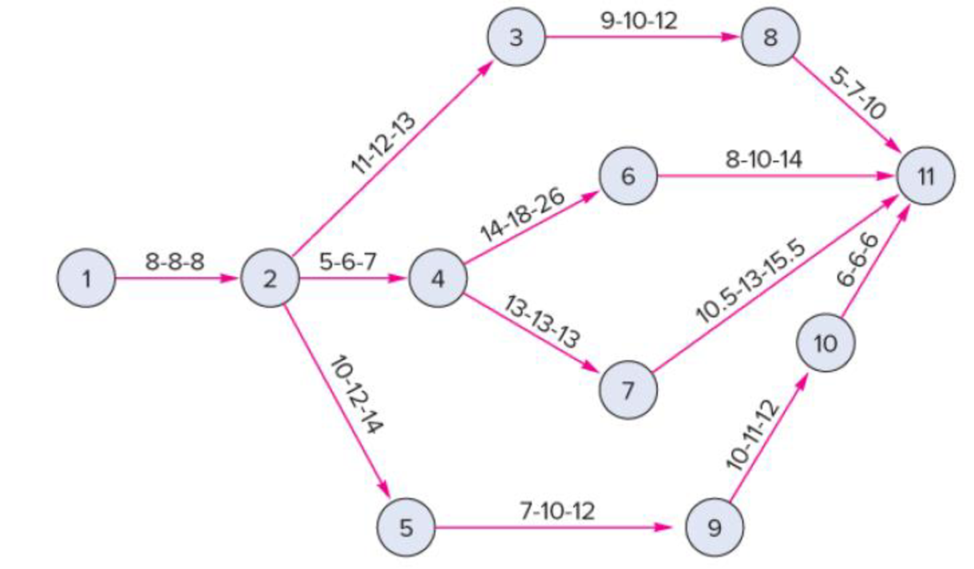
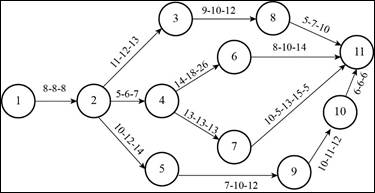
The following precedence diagram reflects three time estimates in weeks for each activity. Determine:
a. The expected completion time for each path and its variance.
b. The probability that the project will require more than 49 weeks.
c. The probability that the project can be completed in 46 weeks or less.
a)
To determine: The expected completion time for each path and its variance.
Explanation of Solution
Given information:
| Activity | Optimistic time | Most likely time | Pessimistic time |
| 1 to 2 | 8 | 8 | 8 |
| 2 to 3 | 11 | 12 | 13 |
| 2 to 4 | 5 | 6 | 7 |
| 2 to 5 | 10 | 12 | 14 |
| 3 to 8 | 9 | 10 | 12 |
| 4 to 6 | 14 | 18 | 26 |
| 4 to 7 | 13 | 13 | 13 |
| 5 to 9 | 7 | 10 | 12 |
| 6 to 11 | 8 | 10 | 14 |
| 7 to 11 | 10.5 | 13 | 15.5 |
| 8 to 11 | 5 | 7 | 10 |
| 9 to 10 | 10 | 11 | 12 |
| 10 to 11 | 6 | 6 | 6 |
Formula to calculate expected time and variance:
Calculation of mean and variance:
| Activity | Optimistic time | Most likely time | Pessimistic time | Expected time | Standard deviation | Variance |
| A | B | C | (A+(4*B)+C)/6 | (C-A)/6 | (C-A)^2/6^2 | |
| 1 to 2 | 8 | 8 | 8 | 8 | 0.000 | 0.000 |
| 2 to 3 | 11 | 12 | 13 | 12 | 0.333 | 0.111 |
| 2 to 4 | 5 | 6 | 7 | 6 | 0.333 | 0.111 |
| 2 to 5 | 10 | 12 | 14 | 12 | 0.667 | 0.444 |
| 3 to 8 | 9 | 10 | 12 | 10.17 | 0.500 | 0.250 |
| 4 to 6 | 14 | 18 | 26 | 18.67 | 2.000 | 4.000 |
| 4 to 7 | 13 | 13 | 13 | 13 | 0.000 | 0.000 |
| 5 to 9 | 7 | 10 | 12 | 9.83 | 0.833 | 0.694 |
| 6 to 11 | 8 | 10 | 14 | 10.33 | 1.000 | 1.000 |
| 7 to 11 | 10.5 | 13 | 15.5 | 13 | 0.833 | 0.694 |
| 8 to 11 | 5 | 7 | 10 | 7.17 | 0.833 | 0.694 |
| 9 to 10 | 10 | 11 | 12 | 11 | 0.333 | 0.111 |
| 10 to 11 | 6 | 6 | 6 | 6 | 0.000 | 0.000 |
Calculation of expected duration, variance and standard deviation for each path:
Path 1-2-3-8-11:
Path 1-2-4-6-11:
Path 1-2-4-7-11:
Path 1-2-5-9-11:
b)
To determine: The probability that the project will require more than 49 weeks.
Answer to Problem 11P
Explanation of Solution
Calculation of probability of completion in more than 49 weeks:
Calculation of z value for all paths:
Formula:
Greater than 49 weeks:
Path 1-2-3-8-11:
Since z value is greater than +3.00, probability of completion is 1.00.
Path 1-2-4-6-11:
From the standard normal distribution table,
The probability value for (z = 2.261) is 0.9960.
Path 1-2-4-7-11:
Since z value is greater than +3.00, probability of completion is 1.00.
Path 1-2-5-9-10-11:
From the standard normal distribution table,
The probability value for (z = 1.94) is 0.9738.
Probability of completion in less than or equal to 49 weeks:
Calculation of probability of completion in greater than 49 weeks:
The probability that the project will require more than 49 weeks is 0.0301.
c)
To determine: The probability that the project will be completed in 46 weeks or less.
Answer to Problem 11P
Explanation of Solution
Calculation of probability of completion in 46 weeks or less:
Calculation of z value for all paths:
Formula:
Path 1-2-3-8-11:
Since z value is greater than +3.00, probability of completion is 1.00.
Path 1-2-4-6-11:
From the standard normal distribution table,
The probability value for (z = 1.33) is 0.9082.
Path 1-2-4-7-11:
Since z value is greater than +3.00, probability of completion is 1.00.
Path 1-2-5-9-10-11:
From the standard normal distribution table,
The probability value for (z = -0.74) is 0.2296.
Probability of completion in less than or equal to 46 weeks:
The probability that the project will be completed in 46 weeks or less is 0.2085.
Want to see more full solutions like this?
Chapter 17 Solutions
Operations Management (13th Edition With Chapters Selected By Buddhadev Roychoudhury)


- The estimated times and immediate predecessorsfor the activities in a project at George Kyparis’s retinal scan-ning company are given in the following table. Assume thatthe activity times are independent. a) Calculate the expected time and variance for each activity.b) What is the expected completion time of the critical path?What is the expected completion time of the other path inthe network?c) What is the variance of the critical path? What is the vari-ance of the other path in the network?d) If the time to complete path A–C is normally distributed,what is the probability that this path will be finished in22 weeks or less?e) If the time to complete path B–D is normally distributed,what is the probability that this path will be finished in22 weeks or less?f) Explain why the probability that the critical path will befinished in 22 weeks or less is not necessarily the probabil-ity that the project will be finished in 22 weeks or less.arrow_forwardGiven the following table, construct a network diagram, either AOA or AON. Times are in days.a. Determine the expected duration of the project.b. Compute the probability that the project will take at least 18 days.Path Activity Time EstimatesA 4-5-6Top B 7-8-10C 3-5-9D 7-8-11Bottom E 2-3-4F 1-4-6arrow_forwardThe estimated times and immediate predecessors for the activities in a project a t George Kyparis's retinal scanning company are given in the following table. Assume that the activitytimes are independent. a) Calculate the expected time and variance for each activity.b) What is the expected completion time of the critical path?What is the expected completion time of the other path in the network?c) What is the variance of the critical path? Wha t is the variance of the other path in the network?d) If the time to complete path A-C is normally distributed, what is the probability that this path will be fini shed in 22 weeks or less?e) If the time to complete path B- D is normally distributed, what is the probability that this path will be finished in 22 weeks or less?f) Explain why the probability that the critical path will be finished in 22 weeks or…arrow_forward
- #3) Consider the following project, all durations are in days. Construct a precedence diagram, find the critical path and which tasks have slack and how much each has. Which tasks would you recommend crashing to reduce the project duration by six days assuming that it costs the same to crash each task and no task by be crashed to more than half its original duration and tasks A and N cannot be crashed at all? Task Predecessors Most Likely Duration A - 8 B A 12 C A 6 D A 12 E B 10 F E 7 G C 18 H C 13 I G 10 J H 13 K D 10 L K 11 M L 7 N F, I, J, M 4 Note:- Do not provide handwritten solution. Maintain accuracy and quality in your answer. Take care of plagiarism. Answer completely. You will get up vote for sure.arrow_forwardConsider the simple dependency matrix shown in Table 19.12.Which of the following statements is correct? a. The two activities are independent of each other and the project can carry out both of them immediately. b. A1 is a predecessor activity to A2. c. A2 is a predecessor activity to A1. d. None of these statements is correctarrow_forwardWhich project management approach follows a deterministic approach and assumes the activity duration is a known certainty? a) PERT b) CPM c) Network Diagram d) JIT e) ABCarrow_forward
- Key: A is optimist time, M is the most likely time and B is the pessimistic time. i). Calculate the expected time for each activity ii. Draw a Gantt Chart from the same information above iii. State the critical path and the maximum number of weeks the project will take to be completed. iv. Discuss the pros and cons of using the Gantt chart as a planning and scheduling tool?arrow_forwardDraw CPM network of activities tabulated below: 1. Calculate the expected duration and the standard deviation for the critical path. 2. Compute the followings: (a) The probability that the project will finish by the end of day 50 (b) The probability that the project will finish at day 52 (c) The probability that the project will finish before the start of day 49. (d) The completion date with at least a 95% confidence levelarrow_forwardThe Laurenster Corporation needs to set up an as-sembly line to produce a new product. The fol-lowing table describes the relationships among the activities that need to be completed for this productto be manufactured. (a) Develop a project network for this problem.(b) Determine the expected duration and variancefor each activity.arrow_forward
- The project manager must make trade-offs between project progress and process. Conceptually, this involves trade-offs between the __________ functions. a. schedule and cost b. technical and managerial c. cost and performance d. performance and schedulearrow_forwardYou may need to use the appropriate technology to answer this question. Mueller & Associates is a urban planning firm that is designing a new public park in an Omaha suburb. Coordination of the architect and subcontractors will require a major effort to meet the 43-week completion date requested by the owner. The Mueller project manager prepared the following project network. A project network with 10 activities and 14 directed arcs is shown. Activity Start is connected to activity A. Activity A is connected to activity B, to activity C, and to activity D. Activity B is connected to activity F. Activity C is connected to activity E and to activity F. Activity D is connected to activity E. Activity E is connected to activity G and to activity Finish. Activity F is connected to activity G and to activity H. Activity G is connected to activity H. Activity H is connected to activity Finish. Activity Finish has no arcs directed to other activities. Estimates of the optimistic, most…arrow_forwardYou may need to use the appropriate technology to answer this question. Mueller & Associates is a urban planning firm that is designing a new public park in an Omaha suburb. Coordination of the architect and subcontractors will require a major effort to meet the 43-week completion date requested by the owner. The Mueller project manager prepared the following project network. A project network with 10 activities and 14 directed arcs is shown. Activity Start is connected to activity A. Activity A is connected to activity B, to activity C, and to activity D. Activity B is connected to activity F. Activity C is connected to activity E and to activity F. Activity D is connected to activity E. Activity E is connected to activity G and to activity Finish. Activity F is connected to activity G and to activity H. Activity G is connected to activity H. Activity H is connected to activity Finish. Activity Finish has no arcs directed to other activities. Estimates of the optimistic, most…arrow_forward
 Practical Management ScienceOperations ManagementISBN:9781337406659Author:WINSTON, Wayne L.Publisher:Cengage,
 Operations ManagementOperations ManagementISBN:9781259667473Author:William J StevensonPublisher:McGraw-Hill Education
 Operations and Supply Chain Management (Mcgraw-hi...Operations ManagementISBN:9781259666100Author:F. Robert Jacobs, Richard B ChasePublisher:McGraw-Hill Education
 Purchasing and Supply Chain ManagementOperations ManagementISBN:9781285869681Author:Robert M. Monczka, Robert B. Handfield, Larry C. Giunipero, James L. PattersonPublisher:Cengage Learning
 Production and Operations Analysis, Seventh Editi...Operations ManagementISBN:9781478623069Author:Steven Nahmias, Tava Lennon OlsenPublisher:Waveland Press, Inc.