
a)
To calculate: The
a)
Explanation of Solution
Given the following demand and supply function of the potato chips
The
To calculate equilibrium, we need to substitute
Hence, the equilibrium quantity and price with respect to given demand and supply function is Q = 20 and P = $40.
In order to calculate conumer surplus, producer surplus and social welfare we need to plot the above demand and supply function.
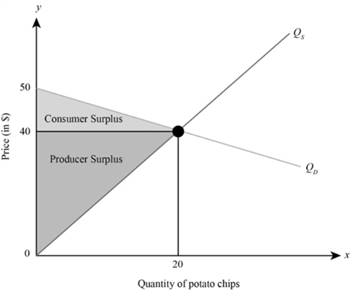
In the graph, the x axis depicts the quantity of potato chips and the y axis depicts the price per potato chips (in $),
Consumer surplus in the graph is represented by triangle A, so to compute consumer surplus, we need to calculate the area of the triangle. Thus, consumer surplus (CS) is
Producer surplus in the graph is represented by triangle B, so to compute producer surplus, we need to calculate the area of the triangle. Thus, producer surplus (PS) is
Social welfare (SW) is the sum of consumer surplus and producer surplus. Thus,
Introduction:
The equilibrium price is the defined as the price level at which both consumer and producer satisfies. It is the price where both want to exchange commodities and services.
b)
To compute: The equilibrium quantity, price, and
b)
Explanation of Solution
Given information:
Perceived demand function,
Supply function,
The equilibrium price is calculated by equating the supply and demand function. Thus, in equilibrium
In order to calculate equilibrium quantity, we need to substitute P = $80 into either the demand or supply function. Thus, equilibrium quantity is
Hence, the equilibrium quantity and price with respect to given demand and supply function is
In order to calculate deadweight loss we need to plot the above demand function and supply function. This has been done below:
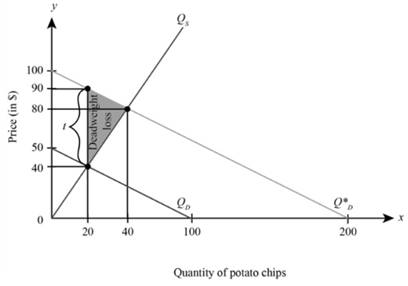
In the graph, the x axis measures the quantity of potato chips and the y axis measures the price per potato chips (in $),
When it assumed that consumer behavious is influenced by his or her limited cognitive ability, then his percieved demand curve is
The deadweight loss indicating loss in social welfare due to extra purchase of potato chips than required is represented by triangle C and D. to compute the deadweight loss we need to calculate the area of triangle C and D. Thus
Thus, deadweight loss is
Introduction: A deadweight loss is an expense to economy that is caused by market failure, when supply and demand are out of equilibrium. Primarily used in economics, deadweight loss can be extended to any deficit caused by inadequate resource allocation.
c)
To compute: The per unit tax that the government could impose to correct the deadweight loss problem.
c)
Explanation of Solution
In order to correct the deadweight loss of 500 due to extra purchase of potato chips, government could impose a specific tax,
As a result, the consumer will reduce its purchase of potato chips from 40 units to 20 units on account of increased price of potato chips to $90.
Introduction: A deadweight loss is an expense to economy that is caused by market failure, when supply and demand are out of equilibrium. Primarily used in economics, the loss of deadweight can be extended to any deficit caused by inadequate resource allocation.
d)
To compute: The deadweight loss the governement has introduced with the tax if instead the government made a mistake and the second demand is actually the true demand stemming from rational decisions.
d)
Explanation of Solution
Dead weight loss happens when there is no equilibrium between supply and demand which leads to market failure. Market inefficiency happens when products are either overvalued or undervalued inside the industry. Although the disparity will favor some people in society, a change from equilibrium would negatively affect others.
If it is assumed that
Introduction: A deadweight loss is an expense to economy that is caused by market failure, when supply and demand are out of equilibrium. Primarily used in economics, the loss of deadweight can be extended to any deficit caused by inadequate resource allocation.
Want to see more full solutions like this?
Chapter 17 Solutions
Intermediate Microeconomics and Its Application, 12th edition with CD-ROM (Exclude Access Card)

- Consider two treatments. Treatment 1 saves one year of life at a cost of $10,000. Treatment 2 saves ten years of life at a cost of $1,000,000. Which treatment is more cost-effective? Why? Consider two treatments. Treatment 1 saves six years of quality adjusted life at a cost of $90,000. Treatment 2 saves three years of quality adjusted life at a cost of $60,000. Which treatment is preferred from a cost utility analysis perspective? Suppose Jay has been experiencing back pain and that there are two options for back pain: Treatment Regimen Total Cost Pain Reduction Do nothing $0 0 units Cortisone injections $600 30 units Calculate the ICER between cortisone injections and doing nothing. Jay says he is willing to pay $10 for a per unit of pain reduction. Should he choose cortisone injections? Another treatment is discovered. It costs $700 and reduces pain by 25 units. Should he choose the new treatment?arrow_forwardBehavioral economics a. integrates psychological insights into economic models. b. relies on the assumption that homo economicus describes economic decision-making. c. assumes that economic agents have full information about the conditions surrounding their decisions. d. All of the above are correct.arrow_forwardWhich of the following about emotional influence on decision making is true? People generally make rational decisions that maximize desirable outcomes in the absence of emotions Only emotions that are relevant to the decision at hand have any influence on that decision People tend to overestimate their predicted negative emotions resulting from a decision's outcomes People are equally angry about unfair offers in the ultimatum game from computers and from other human playersarrow_forward
- Two players play the Ultimatum Game, in which they are to split $20. A purely rational agent would only reject an offer of … Group of answer choices... -$20 -$19 -$1 -$0 -$10arrow_forwardTo make policy choices that involve gainers and losers, we need to have a restricted principle for making interpersonal utility comparisons. TRUE OR FALSEarrow_forwardIn a sealed-bid, second-price auction with complete information, the winner is the bidder who submits the second-highest price, but pays the price submitted by the highest bidder. Do you agree? Explain.arrow_forward
- Economic analysis is limited in its ability to forecast precise choices of a given individual because:arrow_forwardThe primary research finding from studies of the “Ultimatum Game” is that when most people make economic decisions they … (choose one) -optimize. -consider the issue of fairness. -meliorate. -apply the availability heuristic.arrow_forwardEvaluate the following statement. “We shouldn’t generalize from what people do in the ultimatum game because $10 is a trivial amount of money. When larger amounts of money are on the line, people will act differently.”arrow_forward
- Someone who pays $800 to fly from one city to another instead of paying only $100 for a bus trip between the two cities is making an irrational choice and is thus not maximizing his utility. O True O False Note:- Do not provide handwritten solution. Maintain accuracy and quality in your answer. Take care of plagiarism. Answer completely. You will get up vote for sure.arrow_forwardSuppose Kenji is willing to pay a total of $180,000 for an antique car. True or False: Keeping his maximum willingness to pay for an antique car in mind, Kenji will buy the antique car because it would be worth more to him than its market price of $225,000. True Falsearrow_forwardTwo players play the Ultimatum Game, in which they are to split $20. A purely rational agent would only reject an offer of …arrow_forward

 Principles of Economics (12th Edition)EconomicsISBN:9780134078779Author:Karl E. Case, Ray C. Fair, Sharon E. OsterPublisher:PEARSON
 Engineering Economy (17th Edition)EconomicsISBN:9780134870069Author:William G. Sullivan, Elin M. Wicks, C. Patrick KoellingPublisher:PEARSON
 Principles of Economics (MindTap Course List)EconomicsISBN:9781305585126Author:N. Gregory MankiwPublisher:Cengage Learning
 Managerial Economics: A Problem Solving ApproachEconomicsISBN:9781337106665Author:Luke M. Froeb, Brian T. McCann, Michael R. Ward, Mike ShorPublisher:Cengage Learning
 Managerial Economics & Business Strategy (Mcgraw-...EconomicsISBN:9781259290619Author:Michael Baye, Jeff PrincePublisher:McGraw-Hill Education