
Concept explainers
(a)
Interpretation:
For an angle of incidence of 450, the effective penetration depth of the evanescent wave should be determined. Penetration depth if the angle changed to 600 should be determined.
Concept introduction:
The effective penetration depth can be calculated as follows:
Here,
Answer to Problem 17.13QAP
When the angle of incidence = 450
When the angle of incidence = 600
Explanation of Solution
When the angle of incidence = 450
When the angle of incidence = 600
(b)
Interpretation:
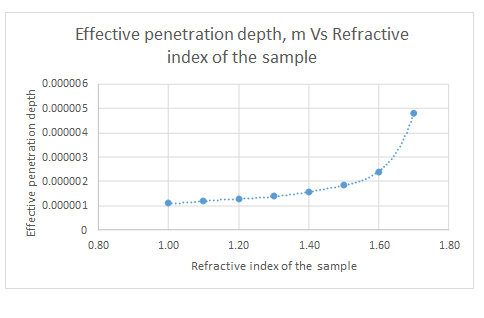
The penetration depths for sample refractive indexes varying from 1.00 to 1.70 in steps of 0.10 should be determined. Penetration depth should be plotted as a function of refractive index. The refractive index for which the penetration depth becomes zero should be determined.
Concept introduction:
Answer to Problem 17.13QAP
The plot is represented as follows:
Explanation of Solution
The data given is as follows:
| Refractive index of sample | dp, m |
| 1.00 | 1.12597E-06 |
| 1.10 | 1.19018E-06 |
| 1.20 | 1.27491E-06 |
| 1.30 | 1.39125E-06 |
| 1.40 | 1.56143E-06 |
| 1.50 | 1.8387E-06 |
| 1.60 | 2.40057E-06 |
| 1.70 | 4.80114E-06 |
The plot for the data is represented as follows:
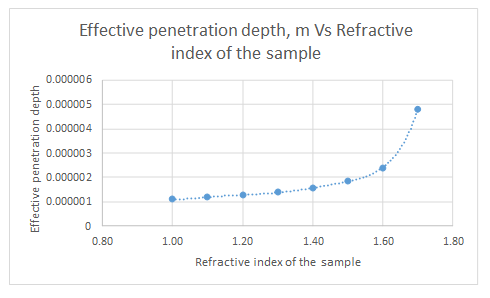
From the graph, it can be seen that the refractive index never approaches zero.
(c)
Interpretation:
For a sample with a refractive index 1.37 at 2000 cm-1 and incident angle of 450, the penetration depth versus the ATR crystal refractive index should be plotted.
Concept introduction:
The effective penetration depth can be calculated as follows:
Here,
Answer to Problem 17.13QAP
Ge crystal will give smaller penetration depth as a refractive index of the crystal increases, the effective penetration depth decreases.
Explanation of Solution
The data given is as follows:
| Refractive index of Crystal | dp, m |
| 2.00 | 4.53849E-06 |
| 2.25 | 2.21456E-06 |
| 2.50 | 1.78166E-06 |
| 2.75 | 1.58661E-06 |
| 3.00 | 1.47477E-06 |
| 3.25 | 1.40242E-06 |
| 3.50 | 1.35201E-06 |
| 3.75 | 1.31509E-06 |
| 4.00 | 1.28702E-06 |
The plot is represented as follows:
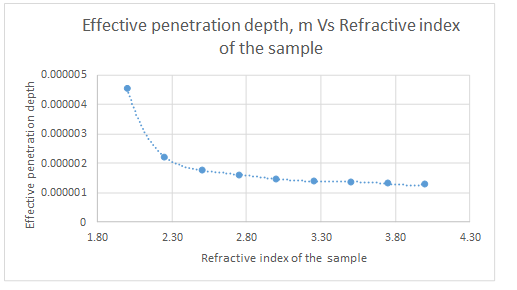
Ge crystal will give smaller penetration depth as a refractive index of the crystal increases, the effective penetration depth decreases.
(d)
Interpretation:
The effective penetration depth at 3000 cm-1, 2000 cm-1 and 2000 cm-1 should be determined.
Concept introduction:
The effective penetration depth can be calculated as follows:
Here,
Answer to Problem 17.13QAP
At 3000 cm-1
At 2000 cm-1
At 1000 cm-1
Explanation of Solution
At 3000 cm-1
At 2000 cm-1
At 1000 cm-1
In case of analyzing aqueous samples, pouring shallow amount over the surface of the crystal is sufficient. Since trace amounts are used to analyze, absorption by the aqueous solvent is not a problem.
(e)
Interpretation:
The principles of the new method to obtain a depth profile of a sample surface using ATR spectroscopy should be described.
Concept introduction:
In ATR spectroscopy through the ATR crystal, an infrared beam is passed such that it reflects off the internal surface at least once when in contact with the sample. This reflection results in an evanescent wave which goes into the sample. The penetration depth is determined by the wavelength of IR beam, angle of incidence, refractive indexes of sample and the crystal.
Explanation of Solution
A new depth profiling method using multiple-angle ATR/FT-IR spectroscopy has been developed.
First, a profile frequency is defined then the stratified medium is defined. Matrix A is generated from interpolated absorptances and matrix E is generated from estimated mean square electric fields. Linear equations of absorptance by SVD method is solved and the first estimated refractive index profile from matrix X is calculated. Nonlinear fittings of the reflectances are determined by Levenberg-Marquadt method. Finally, complex refractive index profile is obtained.
Want to see more full solutions like this?
Chapter 17 Solutions
Principles of Instrumental Analysis


- Assuming that the density of silica gel is 2.65 g cm-3 and that the silica particle are spherical with an average radius of 5 x 10⁻⁶ cm, calculate the estimated surface area Sest. Why is there such a large difference between S and Sest?arrow_forward3.) The accuracy of a spectrophotometer is evaluated by preparing a solution of 60.06 ppm K2Cr2O7 and measuring its absorbance at a wavelength of 350 nm in a cell with a pathlength of 1.00 cm. The expected absorbance is 0.640. What is the expected molar absorptivity of K2Cr2O7 at this wavelength?arrow_forwardBriefly describe how a phase-contrast microscope work and the kind of image that itproduces. Give a specific use for this type of microscope.arrow_forward
- What is involved in Phases l and Phases ll of biotransformation?arrow_forwardCalculate the absorbance at 280 nm that is expected for a 17 microM solution of peptide GRAYISH, if a 10-cm cuvette is used. For the extinction coefficient, take into account that e280(Trp) = 5690 M-1 cm-1 and e280(Tyr) = 1280 M-1 cm-1.arrow_forwardA spectral line of 48Ti8+ in a distant star was found to be shifted from 654.2 nm to 706.5 nm and to be broadened to 61.8 pm. What are the speed of recession and the surface temperature of the star?arrow_forward
- Calculate the molarity of KMnO4 stock solution X used for the analysis. Plot a graph of absorbance A vs. wavelength λ and determine the λ max (maximum wavelength).arrow_forwardWhat are the basic differences between absorption & adsorption, and sorption?arrow_forwardThe absorbance of a 1.05x10⁻⁵ M Fe+3 determined at 580 nm using a 2.50-cm cell was said to be 0.200. What is the molar absorptivity of this solution in liters/mole cm?arrow_forward
- 1) Compare the techniques of open-path FTIR versus extractive FTIR using gas cells for the analysis of gaseous compounds. Contrast the difference in their instrumentation and analytical procedures and briefly state the analytical applications of each method 2) A Chromophore is___________ 3) The X-ray microanalysimicro analysis technique in a scanning electron microscope involves the transitions of___ 4) What are the radiation sources for Infrared and Near Infrared spectra 5) A typical source for Raman spectroscopy is________arrow_forwardIt is usually recommended to clean the glass surfaces of a refractometer with ethanol or isopropyl alcohol rather than acetone or water. Why?arrow_forwardDescribe the origin of shot noise in a spectrophotometer. How does the relativeuncertainty vary with concentration if shot noise is the major noise source?arrow_forward
 Principles of Instrumental AnalysisChemistryISBN:9781305577213Author:Douglas A. Skoog, F. James Holler, Stanley R. CrouchPublisher:Cengage Learning