
Videos
Interpretation:
From the data given the order of the reaction, rate constant and the molar concentration of
Explanation of Solution
For the first order reaction:
Plot a graph between
Below is the graph:
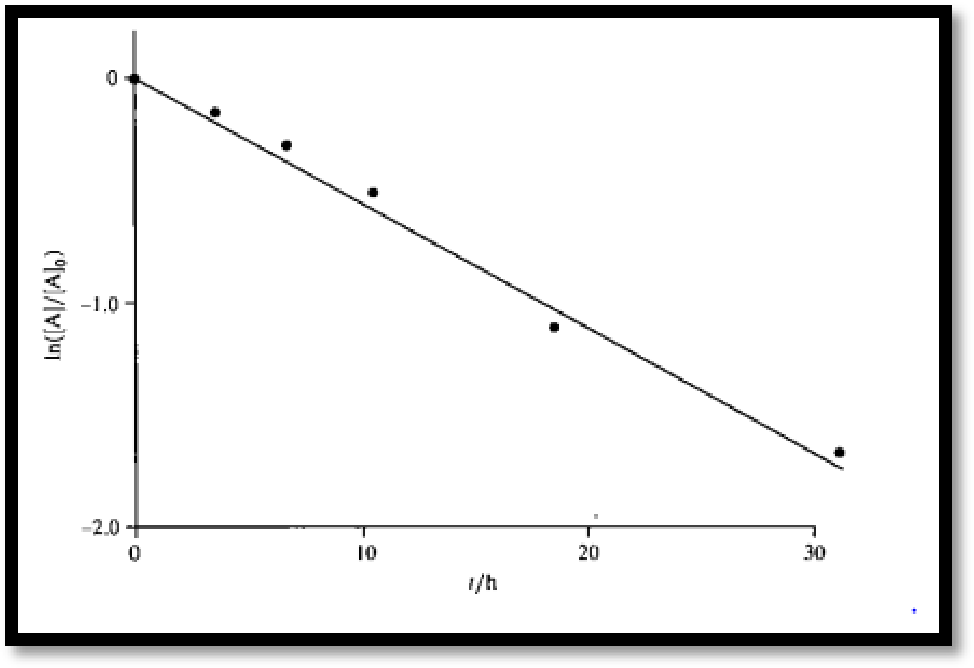
Figure.1
From the graph it is clear that it is a first order reaction.
The rate constant is negative of the slope of the first order plot:
Want to see more full solutions like this?
Chapter 17 Solutions
PHYSICAL CHEMISTRY. VOL.1+2 (LL)(11TH)


 ChemistryChemistryISBN:9781305957404Author:Steven S. Zumdahl, Susan A. Zumdahl, Donald J. DeCostePublisher:Cengage Learning
 ChemistryChemistryISBN:9781259911156Author:Raymond Chang Dr., Jason Overby ProfessorPublisher:McGraw-Hill Education
 Principles of Instrumental AnalysisChemistryISBN:9781305577213Author:Douglas A. Skoog, F. James Holler, Stanley R. CrouchPublisher:Cengage Learning
 Organic ChemistryChemistryISBN:9780078021558Author:Janice Gorzynski Smith Dr.Publisher:McGraw-Hill Education
 Chemistry: Principles and ReactionsChemistryISBN:9781305079373Author:William L. Masterton, Cecile N. HurleyPublisher:Cengage Learning
 Elementary Principles of Chemical Processes, Bind...ChemistryISBN:9781118431221Author:Richard M. Felder, Ronald W. Rousseau, Lisa G. BullardPublisher:WILEY