Applied Statistics in Business and Economics
5th Edition
ISBN: 9781259329050
Author: DOANE
Publisher: MCG
bartleby

Concept explainers

bartleby

Videos

Textbook Question
Book Icon
Chapter 17, Problem 55CE

A new type of smoke detector battery is developed. From laboratory tests under standard conditions, the half-lives (defined as less than 50 percent of full charge) of 20 batteries are shown below. (a) Make a histogram of the data and/or a probability plot. Do you think that battery half-life can be assumed normal? (b) The engineers say that the mean battery half-life will be 8,760 hours with a standard deviation of 200 hours. Using these parameters (not the sample), set up the centreline and control limits for the x ¯ chart for a subgroup size of n = 5 batteries to be sampled in future production runs. (c) Repeat the previous exercise, but this time, use the sample mean and standard deviation. (d) Do you think that the control limits from this sample would be reliable? Explain, and suggest alternatives.

Chapter 17, Problem 55CE, A new type of smoke detector battery is developed. From laboratory tests under standard conditions,

(a)

Expert Solution
Check Mark
To determine

Sketch a histogram and normal probability plot for the sample.

Explain whether the battery half-life can be assumed normal or not.

Answer to Problem 55CE

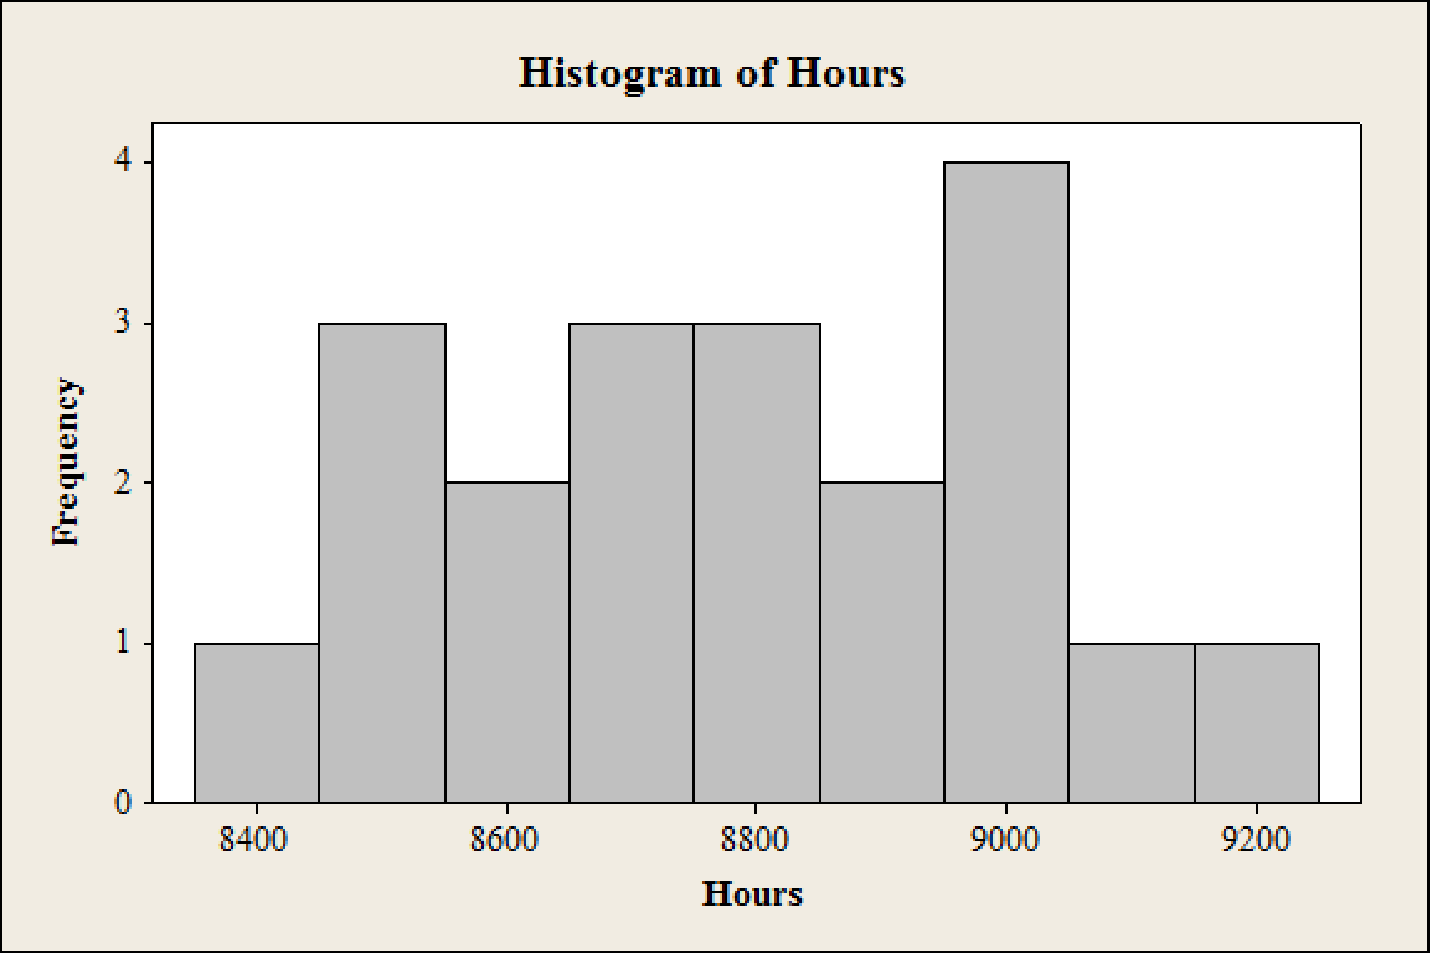
The histogram for the sample is,

Applied Statistics in Business and Economics, Chapter 17, Problem 55CE , additional homework tip  1

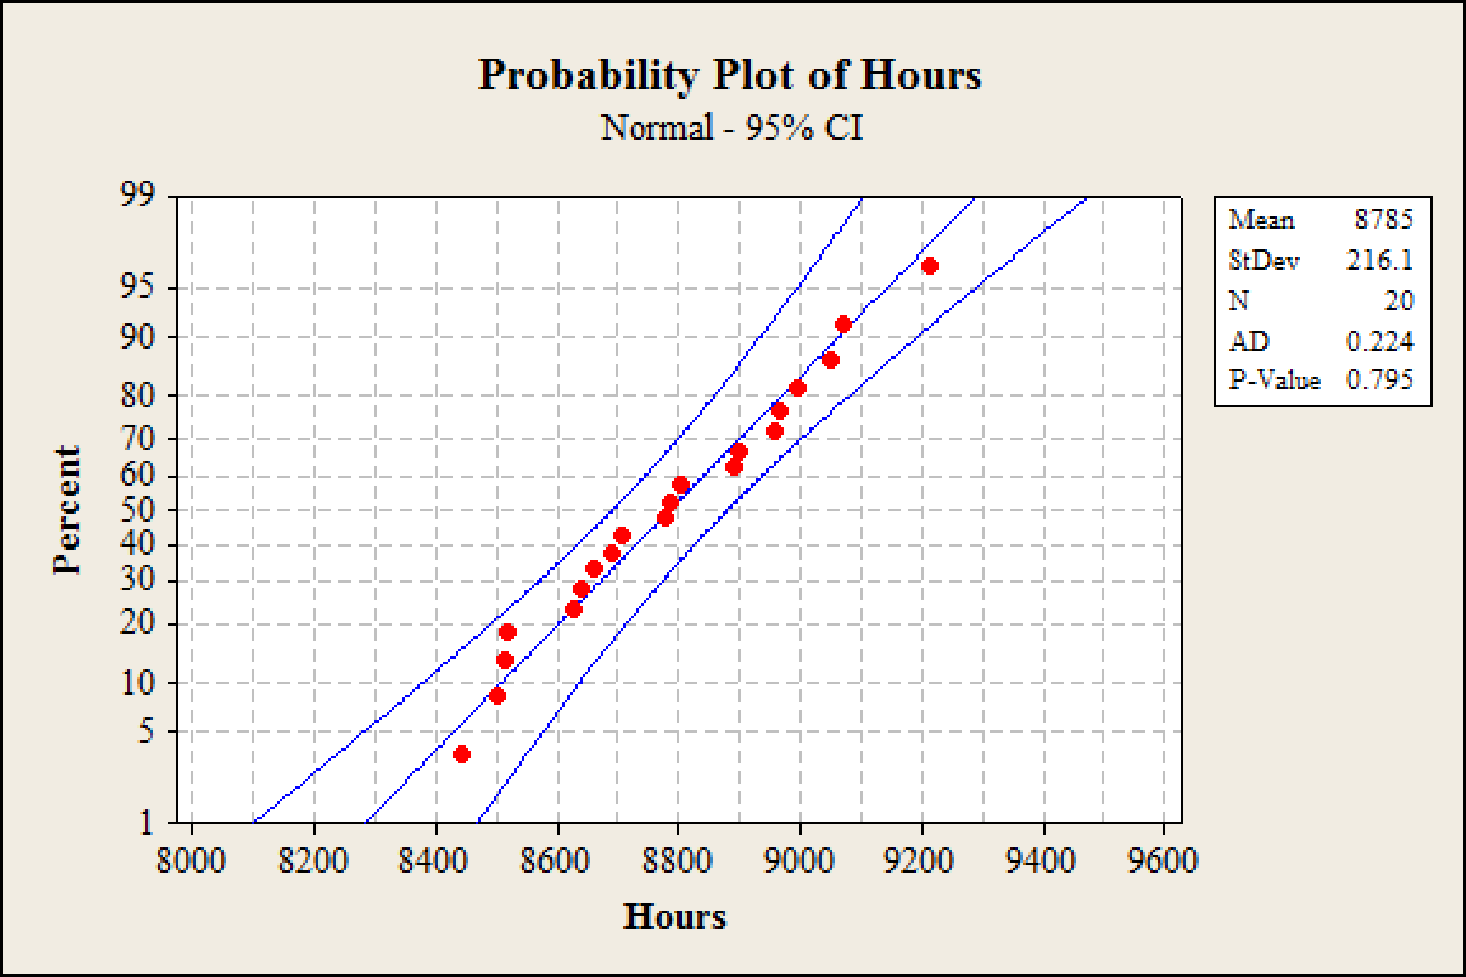
The normal probability plot for the sample is,

Applied Statistics in Business and Economics, Chapter 17, Problem 55CE , additional homework tip  2

The battery half-life can be assumed normal.

Explanation of Solution

Calculation:

The given information is that, the half-lives of the 20 batteries are considered.

Histogram for hours:

Software procedure:

Step-by-step procedure to obtain the histogram for ‘hours’ using the MINITAB software:

  • • Choose Graph > Histogram.
  • • Choose Simple, and then click OK.
  • • In Graph variables, enter the corresponding column ‘Hours’.
  • • Click OK

Normal Probability plot for hours:

Software procedure:

Step-by-step procedure to obtain the normal probability plot for ‘hours’ using the MINITAB software:

  • • Choose Graph > Probability Plot.
  • • Choose Single, and then click OK.
  • • In Graph variables, enter the column of Hours.
  • • Click OK.

Justification: From the histogram it can be observed that the hours’ is slightly bell-shaped and could be slightly normal. Also, from the normal probability plot it can be observed that the data points of ‘hours all lies within the lines forming the linear pattern and is approximately normal. Overall the distribution of the half-life battery is normally distributed.

Hence, battery half-life can be assumed normal.

(b)

Expert Solution
Check Mark
To determine

Find the centerline and control limits for the x¯ chart for a subgroup size of n=5 batteries.

Answer to Problem 55CE

The centerline is 8,760 and control limits for an x¯ chart are (8,491.67, 9,028.33).

Explanation of Solution

Calculation:

The given information is that, the subgroup size is n=5. The mean of battery half-life is μ=8,760hours and standard deviation σ=200hours

Control limits with known μ and σ:

If the values of μ and σ are known then the 3-sigma limits for the control chart are,

UCL=μ+3σn(Upper control limit)CL=μ(Centerline)LCL=μ3σn(Lower control limit)

In the formula, μ denotes the average of means of all samples, σ denotes the standard deviation, and n denotes the subgroup size.

Control limits for an x¯ chart:

Substitute, μ=8,760hours, σ=200hours and n=5 in the formulas of UCL and LCL.

UCL=8,760+3(2005)=8,760+3(89.4427)=8,760+268.3282=9,028.33

CL=8,760

LCL=8,7603(2005)=8,7603(89.4427)=8,760268.3282=8,491.67

Hence, the control limits for an x¯ chart are (8,491.67, 9,028.33) and centerline is 8,760.

(c)

Expert Solution
Check Mark
To determine

Find the centerline and control limits for the x¯ chart for a subgroup size of n=5 batteries using the sample mean and standard deviation.

Answer to Problem 55CE

The centerline is 8,784.8 and control limits for an x¯ chart using sample mean and sample standard deviation are (8,494.87, 9,074.73).

Explanation of Solution

Calculation:

The given information is that, the half-lives of the 20 batteries are considered. The subgroups size is n=5.

Software procedure:

Step-by-step procedure to obtain the sample mean and standard deviation for ‘hours’ using the MINITAB software:

  • • Choose Stat > Basic Statistics > Display Descriptive Statistics.
  • • In Variables enter the columns Hours.
  • • Choose option statistics, and select Mean, Standard deviation.
  • • Click OK.

Output using MINITAB software is,

Applied Statistics in Business and Economics, Chapter 17, Problem 55CE , additional homework tip  3

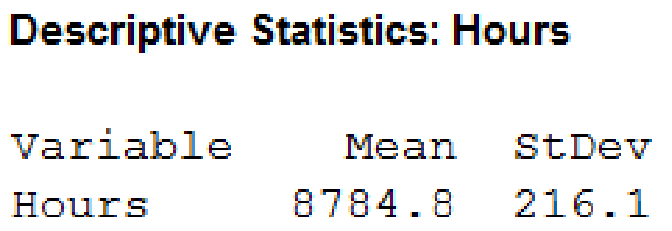
The sample mean is 8,784.8 and sample standard deviation is 216.1.

Empirical control limits:

If the value of μ and σ are not known then the empirical 3-sigma limits for the control chart are obtained by replacing μ with x¯¯, σ with s as,

UCL=x¯¯+3sn(Upper control limit)CL=x¯¯(Centerline)LCL=x¯¯3sn(Lower control limit)

In the formula, x¯¯ denotes the average of means of all samples, s denotes the sample standard deviation, and n denotes the subgroup size.

Control limits for an x¯ chart:

Substitute, x¯¯=8,784.8hours, σ=216.1hours and n=5 in the formulas of UCL and LCL.

UCL=8,784.8+3(216.15)=8,784.8+3(96.6429)=8,784.8+289.9286=9,074.73

CL=8,784.8

LCL=8,784.83(216.15)=8,784.83(96.6429)=8,784.8289.9286=8,494.87

Hence, the control limits for an x¯ chart using sample mean and sample standard deviation are (8,494.87, 9,074.73) and centerline is 8,784.8.

(d)

Expert Solution
Check Mark
To determine

Explain whether the control limits from the sample would be reliable or not.

Suggest an alternative.

Answer to Problem 55CE

The control limits from the sample would not be reliable.

The alternative approach is constructing R chart.

Explanation of Solution

Justification: The mean of battery half-life is μ=8,760hours and standard deviation σ=200hours and the sample mean is 8,784.8 and sample standard deviation is 216.1. It is clear that sample values are not close to the process values. Hence, the control limits from the sample would not be reliable because the size of the sample is small.

Alternative: Since the sample size is large for determining the capability of the process the range chart can be used as an alternative approach. The R chart is a control chart that shows the changes of the range value over a period of time and determines variation around the mean by using the sample ranges.

Want to see more full solutions like this?

Subscribe now to access step-by-step solutions to millions of textbook problems written by subject matter experts!

Chapter 17 Solutions

Applied Statistics in Business and Economics

Ch. 17.3 - Why is the quality improvement process...Ch. 17.3 - Prob. 12SECh. 17.3 - Prob. 13SECh. 17.4 - Prob. 14SECh. 17.4 - Prob. 15SECh. 17.5 - (a) To construct control limits for an x chart,...Ch. 17.5 - Prob. 17SECh. 17.5 - List four rules for detecting abnormal (special...Ch. 17.5 - Set up control limits for an x chart, given x =...Ch. 17.5 - Prob. 20SECh. 17.5 - Prob. 21SECh. 17.5 - To print 8.5 5.5 note pads, a copy shop uses...Ch. 17.6 - Prob. 23SECh. 17.6 - Prob. 24SECh. 17.7 - Prob. 25SECh. 17.7 - Prob. 26SECh. 17.7 - Prob. 27SECh. 17.7 - Prob. 28SECh. 17.9 - Prob. 29SECh. 17.9 - Prob. 30SECh. 17.9 - Prob. 31SECh. 17 - Define (a) quality, (b) process, and (c)...Ch. 17 - Prob. 2CRCh. 17 - Prob. 3CRCh. 17 - Prob. 4CRCh. 17 - Prob. 5CRCh. 17 - Prob. 6CRCh. 17 - (a) Who was W. Edwards Deming and why is he...Ch. 17 - List three influential thinkers other than Deming...Ch. 17 - (a) Briefly explain each acronym: TQM, BPR, SQC,...Ch. 17 - (a) What is shown on the x chart? (b) Name three...Ch. 17 - Prob. 11CRCh. 17 - Prob. 12CRCh. 17 - Prob. 13CRCh. 17 - Prob. 14CRCh. 17 - Prob. 15CRCh. 17 - Briefly explain (a) the overadjustment problem,...Ch. 17 - Prob. 32CECh. 17 - Prob. 33CECh. 17 - Prob. 34CECh. 17 - Define three quality metrics that might be used to...Ch. 17 - Prob. 36CECh. 17 - Prob. 37CECh. 17 - Prob. 38CECh. 17 - Prob. 39CECh. 17 - Use your favorite Internet search engine to look...Ch. 17 - Make a fishbone chart (cause-and-effect diagram)...Ch. 17 - Make a fishbone chart (cause-and-effect diagram)...Ch. 17 - Make a fishbone chart (cause-and-effect diagram)...Ch. 17 - Prob. 44CECh. 17 - In painting an automobile, the thickness of the...Ch. 17 - Prob. 46CECh. 17 - Prob. 47CECh. 17 - Prob. 48CECh. 17 - In painting an automobile at the factory, the...Ch. 17 - Prob. 50CECh. 17 - Prob. 51CECh. 17 - Prob. 52CECh. 17 - Prob. 53CECh. 17 - A Nabisco Fig Newton has a process mean weight of...Ch. 17 - A new type of smoke detector battery is developed....Ch. 17 - Prob. 56CECh. 17 - Prob. 57CECh. 17 - Prob. 58CECh. 17 - Each gum drop in two bags of Sathers Gum Drops was...Ch. 17 - Prob. 60CECh. 17 - Prob. 61CECh. 17 - Prob. 62CECh. 17 - Prob. 63CECh. 17 - Refer to the bolt strength problem 17.47. Assuming...Ch. 17 - Refer to the paint problem 17.49 with =1.00 and ...
Knowledge Booster
Background pattern image
Statistics
Learn more about
Need a deep-dive on the concept behind this application? Look no further. Learn more about this topic, statistics and related others by exploring similar questions and additional content below.
Recommended textbooks for you
Text book image
MATLAB: An Introduction with Applications
Statistics
ISBN:9781119256830
Author:Amos Gilat
Publisher:John Wiley & Sons Inc
Text book image
Probability and Statistics for Engineering and th...
Statistics
ISBN:9781305251809
Author:Jay L. Devore
Publisher:Cengage Learning
Text book image
Statistics for The Behavioral Sciences (MindTap C...
Statistics
ISBN:9781305504912
Author:Frederick J Gravetter, Larry B. Wallnau
Publisher:Cengage Learning
Text book image
Elementary Statistics: Picturing the World (7th E...
Statistics
ISBN:9780134683416
Author:Ron Larson, Betsy Farber
Publisher:PEARSON
Text book image
The Basic Practice of Statistics
Statistics
ISBN:9781319042578
Author:David S. Moore, William I. Notz, Michael A. Fligner
Publisher:W. H. Freeman
Text book image
Introduction to the Practice of Statistics
Statistics
ISBN:9781319013387
Author:David S. Moore, George P. McCabe, Bruce A. Craig
Publisher:W. H. Freeman
Statistics 4.1 Point Estimators; Author: Dr. Jack L. Jackson II;https://www.youtube.com/watch?v=2MrI0J8XCEE;License: Standard YouTube License, CC-BY
Statistics 101: Point Estimators; Author: Brandon Foltz;https://www.youtube.com/watch?v=4v41z3HwLaM;License: Standard YouTube License, CC-BY
Central limit theorem; Author: 365 Data Science;https://www.youtube.com/watch?v=b5xQmk9veZ4;License: Standard YouTube License, CC-BY
Point Estimate Definition & Example; Author: Prof. Essa;https://www.youtube.com/watch?v=OTVwtvQmSn0;License: Standard Youtube License
Point Estimation; Author: Vamsidhar Ambatipudi;https://www.youtube.com/watch?v=flqhlM2bZWc;License: Standard Youtube License